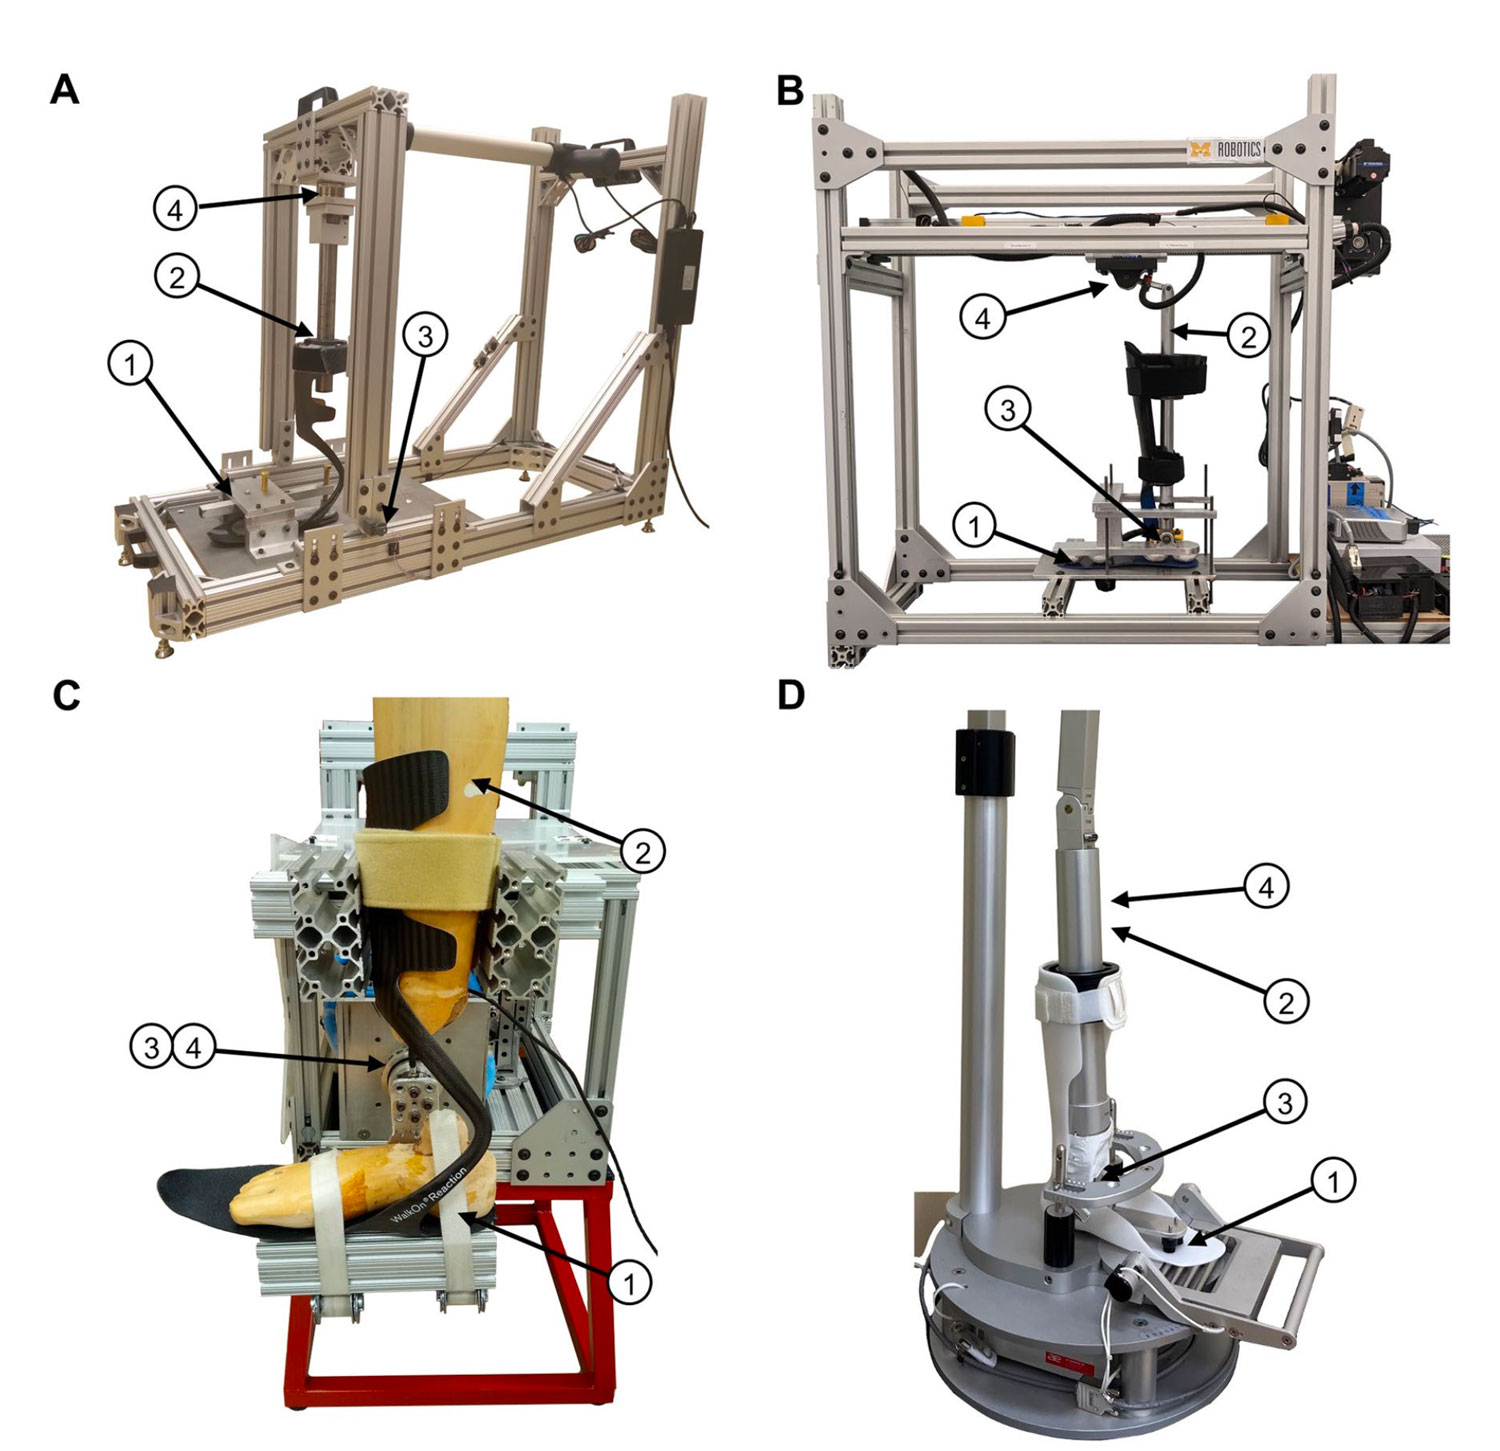
Figure 1. Overview of existing test fixtures. A. EMPIRE, B. SMApp, C. KST, and D. BRUCE. All fixtures secure the AFO for testing by clamping down the footplate using a mock/surrogate/test foot (1) and strapping the tibial cuff to a surrogate shank (2). Angular displacement of the AFO is measured at the axis of rotation using an encoder (3) and applied loads are measured using a load cell (4). Note that the AFO pictured in the BRUCE was not one tested in this study.
By Benjamin R. Shuman, Deema Totah, Deanna H. Gates, Fan Gao, Andrew J. Ries, and Elizabeth Russell Esposito
Non-uniform measurement practices may limit the clinical utility of AFO stiffness as a metric in AFO prescription and future research.
Ankle–foot orthoses (AFOs) are external braces used to support or augment the ankle joint during activities of daily living. A wide variety of custom and commercial AFOs are available to accommodate each AFO user’s individual needs. Differences among AFOs are largely driven by their geometry and mechanical properties. As such, evaluating AFO mechanical properties has received increasing attention in the literature. One of the more common mechanical properties evaluated is the rotational stiffness about the ankle joint, calculated as the change in resistive torque over the change in ankle angle.
Unlike prosthetics where testing standards have been established for prosthetic feet (e.g. ISO 10328 and ISO 22675), no such standards exist for AFOs. Some AFO manufacturers have attempted to adapt these prosthetic standards for AFOs, but the field largely lacks consistent methodology. Methodological differences include inconsistencies with mounting, alignment/bending axis, range of motion, and testing speed. Only 1 study has directly compared AFO properties with 2 devices across 3 AFOs. While similar stiffnesses were found in that study, it is unclear whether those results are generalizable across a range of AFO designs and materials or to other testing devices.
Thus, the goal of this study was to compare the stiffnesses of carbon composite AFOs evaluated using methodologies that have been reported in the literature. The first 4 methods were previously reported test fixtures evaluated for repeatability: The Bi-articular Reciprocating Universal Compliance Estimator (BRUCE), Kentucky Stiffness Tester (KST), the AFO Stiffness Measurement Apparatus (SMApp), and the device for Evaluating Mechanical Properties In Rotating Exoskeletons (EMPIRE). The fifth method manually measured the deflection of an AFO elicited from hanging weights (HW) off of the toe, similar to the approach used in previous studies.
Methods
Thirteen commercially available carbon composite, non-articulated AFOs were tested including: the Blue Rocker, Blue Rocker 2½, ToeOFF, and ToeOFF 2 ½ from Allard (Helsingborg, Sweden), the WalkOn Reaction and WalkOn Reaction Plus from Ottobock (Duderstadt, Germany), the SpryStep, SpryStep Max and SpryStep Plus from Thuasne (Levallois-Perret, France), and the Matrix, Matrix Max, Matrix Max2 and Matrix Supermax from Trulife (Dublin, Ireland). All AFOs except the Ottobock AFOs were the same specimens as previously reported in Shuman & Russell Esposito [J Biomech Eng. 2022;144:1–8.]. All AFOs were right foot models, size large. The same AFO specimens were independently evaluated by each methodology.
The 13 carbon composite AFOs were tested with five different methods. Four previously reported custom test fixtures (the BRUCE, KST, SMApp, and EMPIRE – Figure 1) rotated an AFO into dorsiflexion about a defined axis in the sagittal plane. The fifth method (HW – Figure 2) involved quasi-static deflection of AFOs into dorsiflexion by hanging weights from the footplate. AFO rotational stiffness was calculated as the linear fit of the AFO resistive torque and angular deflection. Differences between methods were assessed using descriptive statistics and a repeated measures Friedman with post-hoc Bonferroni–Holm adjusted Wilcoxon signed-rank tests. For greater detail on the methodology, please review the source article found at the URL at the bottom of the first page of this article.
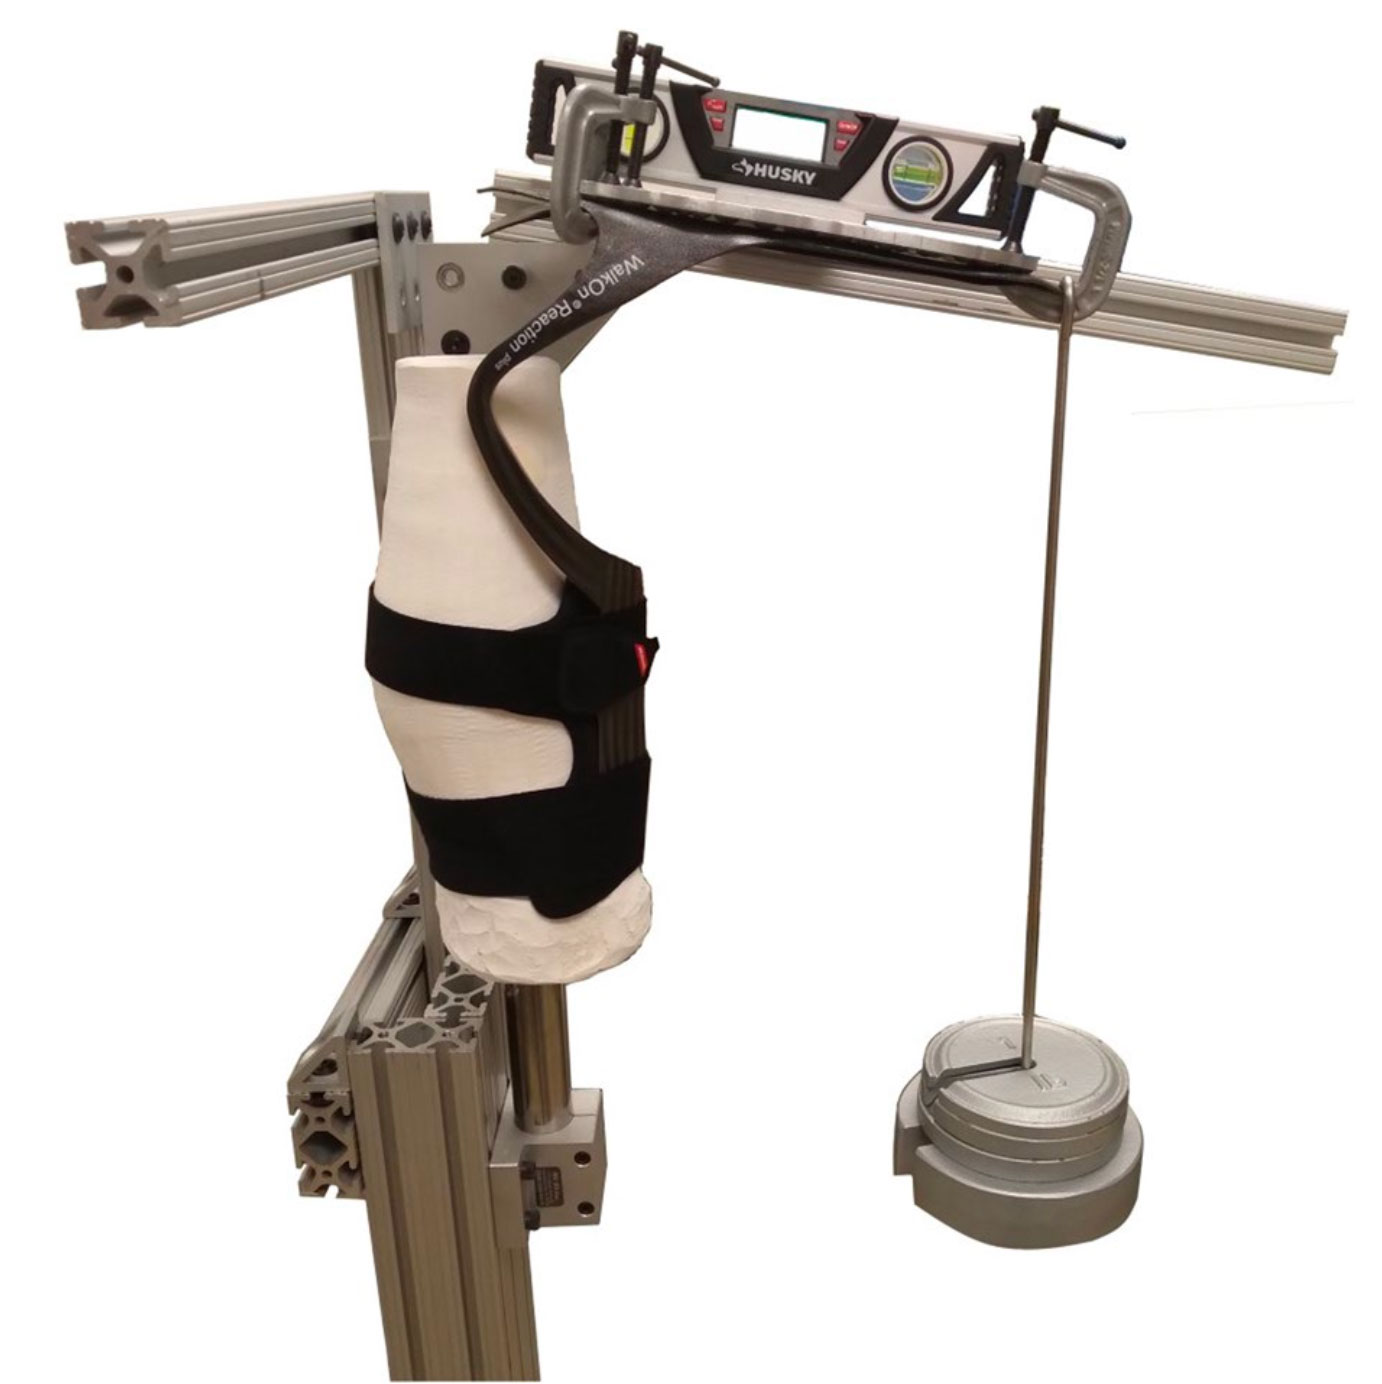
Figure 2. Setup for hanging weight method. In this approach, an AFO is strapped to a surrogate shank and the footplate is clamped to a backing plate. Weights are hung from the AFO toe and the angle of deflection is measured with an inclinometer. Torque is computed from the applied load and the moment arm measured to the center of the surrogate shank.
For the previously reported fixtures, we also computed the average stiffness for each AFO test session in each test method across all measured cycles. For each fixture we compared the differences in AFO stiffness across test sessions using descriptive statistics (median and range). Because the AFOs included span a range of stiffnesses, we report the relative percent differences in AFO stiffness across the sessions, computed as the range in measured stiffness divided by the average stiffness. For each AFO the ratio of the range in stiffness across fixtures to the largest intersession range of stiffness was computed.
For greater detail on the methodology and statistical analysis, please review the source article found at the URL at the bottom of the first page of this article.
Results
All stiffness devices measured a linear relationship between torque and displacement (r2 > 0.95) for all trials (Supplemental files detailing specifics are available at the URL noted on the opening page of this article.)
Each method identified the Blue rocker as the stiffest AFO (except the KST, which ranked it third stiffest of 13), with stiffnesses ranging from 3.21 Nm/deg (KST) to 3.66 Nm/deg (EMPIRE) (Figure 3). All test methods identified the Matrix as the least stiff (0.41 Nm/deg, HW to 0.85 Nm/deg, KST). Across all AFOs, the median difference in absolute AFO stiffness between methods was 1.06 Nm/deg (range: 0.40 to 2.35 Nm/deg). The relative percent differences in stiffnesses was a median of 62% of the average stiffness across methods (range: 13% in the Blue Rocker to 156% in the SpryStep). With the HW method excluded, the median difference in absolute AFO stiffness between methods decreased to 0.52 Nm/deg (range: 0.38 to 2.17 Nm/deg) with relative percent differences in stiffnesses a median of 27% of the average stiffness across methods (range: 13% in the Blue Rocker to 89% in the SpryStep).
Measured AFO stiffness was different across the test methods (P < 0.001) using a Friedman Test. The HW method produced the lowest stiffness values of any method, which were a median of 0.66 (IQR: 0.13 to 0.94), 0.42 (0.08 to 0.62), 0.91 (0.35 to 1.24), and 0.18 (0.01 to 0.67) Nm/deg lower than the EMPIRE, SMApp, KST, and BRUCE respectively (Figure 4). Statistically, the HW method was significantly lower than the EMPIRE (P = 0.006 < 0.007 = α/7, Wilcoxon signed rank post-hoc), and KST (P = 0.002 < 0.006 = α/8) but did not reach the corrected level of significance for the SMApp (P = 0.027 > 0.013 = α/4) or the BRUCE (P = 0.11 > 0.017 = α/3). The KST method measured stiffnesses were significantly greater than the BRUCE (P < 0.001 < 0.005 = α/10) and the EMIRE (P = 0.008 = 0.008 = α/6) by a median of 0.41 (0.36 to 0.74) and 0.27 (0.16 to 0.56) Nm/deg respectively, but not significantly greater than the SMApp (p = 0.013 > 0.01 = α/5) by a median of 0.38 (-0.02 to 0.73) Nm/deg. Across the tested AFOs, the EMPIRE was not significantly different than the SMApp (P = 0.27 > 0.05 = α) by a median of 0.11 (− 0.08 to 0.35) Nm/deg, and was stiffer than the BRUCE (P = 0.001 < 0.006 = α/9) by a median of 0.22 (0.15 to 0.28) Nm/deg. The best agreement between any 2 fixtures’ median values was between the SMApp and the BRUCE with the SMApp not significantly different (P = 0.13 > 0.025 = α/2) with a median of 0.07 (− 0.08 to 0.29) Nm/deg.
Within each previously reported test fixture, median intersession ranges in stiffness were 0.27 Nm/deg in the EMPIRE, 0.11 Nm/deg in the SMApp, 0.11 Nm/deg in the KST, and 0.03 Nm/deg in the BRUCE.

Figure 3. Measured AFO stiffnesses for each of the five test methods. AFOs are ordered from the largest average stiffness to the smallest average stiffness. Average stiffnesses across methods are indicated by an overlaid black line.
Median relative percent differences in stiffness across sessions were 10% (range: 2 to 54%), 3% (< 1 to 14%), 5% (2 to 38%), and 1% (< 1 to 3%) for the EMPIRE, SMapp, KST, and BRUCE respectively. Differences in average measured stiffnesses across fixtures were a median of 2.06 (range: 0.97 to 5.60) times greater than the largest intersession differences for each AFO. Only the intersession differences in stiffness of the Matrix Max 2 (tested in the EMPIRE) were larger than the differences between fixtures.
Discussion
This study demonstrates significant differences in the calculated rotational stiffness of AFOs among 5 test methods. The BRUCE, KST, SMApp, and EMPIRE are all conceptually similar in their design and operation, constraining the rotation of an AFO about a single axis and deflection to the strut. While not all methods were significantly different from one another, these 4 previously reported test methods still had a median inter-method difference of 27% of the average measured stiffness.
A hanging weight (HW) method was included for its simplicity and similarity to previous reports in the literature, but was the most different from the other methods in design and produced the lowest measured stiffnesses. Unlike the other methods, the HW method imparted minimal constraints on the AFO’s motion, resulting in a shifting center point of rotation. The lack of constraints in the HW method allowed the AFOs to experience out of plane rotations, without regard for anatomical motion. While neither the height of rotation, nor the out of plane rotations were quantified in this study, AFOs with lateral struts deflected into inversion and external rotation in addition to dorsiflexion, while AFOs with medial struts also deflected into eversion and internal rotation. These additional deflections may have contributed to the consistently lower stiffnesses measured by the HW method, especially for the less rigid AFOs. With the other 4 custom fixtures, 3 considerations were incorporated for consistency. First, AFO stiffnesses may be sensitive to rotational speed, thus, all test fixtures were operated at relatively slow speeds except the BRUCE, which is manually controlled. Second, the heights of the rotation axes were either mechanically or numerically adjusted to be similar (75–81 mm), as rotation axis may impact stiffness. Third, stiffnesses were all computed as the linear fit of the torque–angle curve while loading into dorsiflexion as previous work with these fixtures have computed stiffness differently, using quasi-static positions, the torque–angle during loading, and the average-torque angle during loading and unloading.
Differences in test fixtures and alignment practices exist, all of which may impact the measured stiffnesses. While the impact of each methodological difference remains unclear, this study demonstrates that the cumulative impact of these differences can have large impacts on measured AFO stiffnesses. It is important to note that these methodological differences do not make one method more or less accurate than another as differences in kinematics and anatomy between AFO users may also impact the user experienced stiffness.
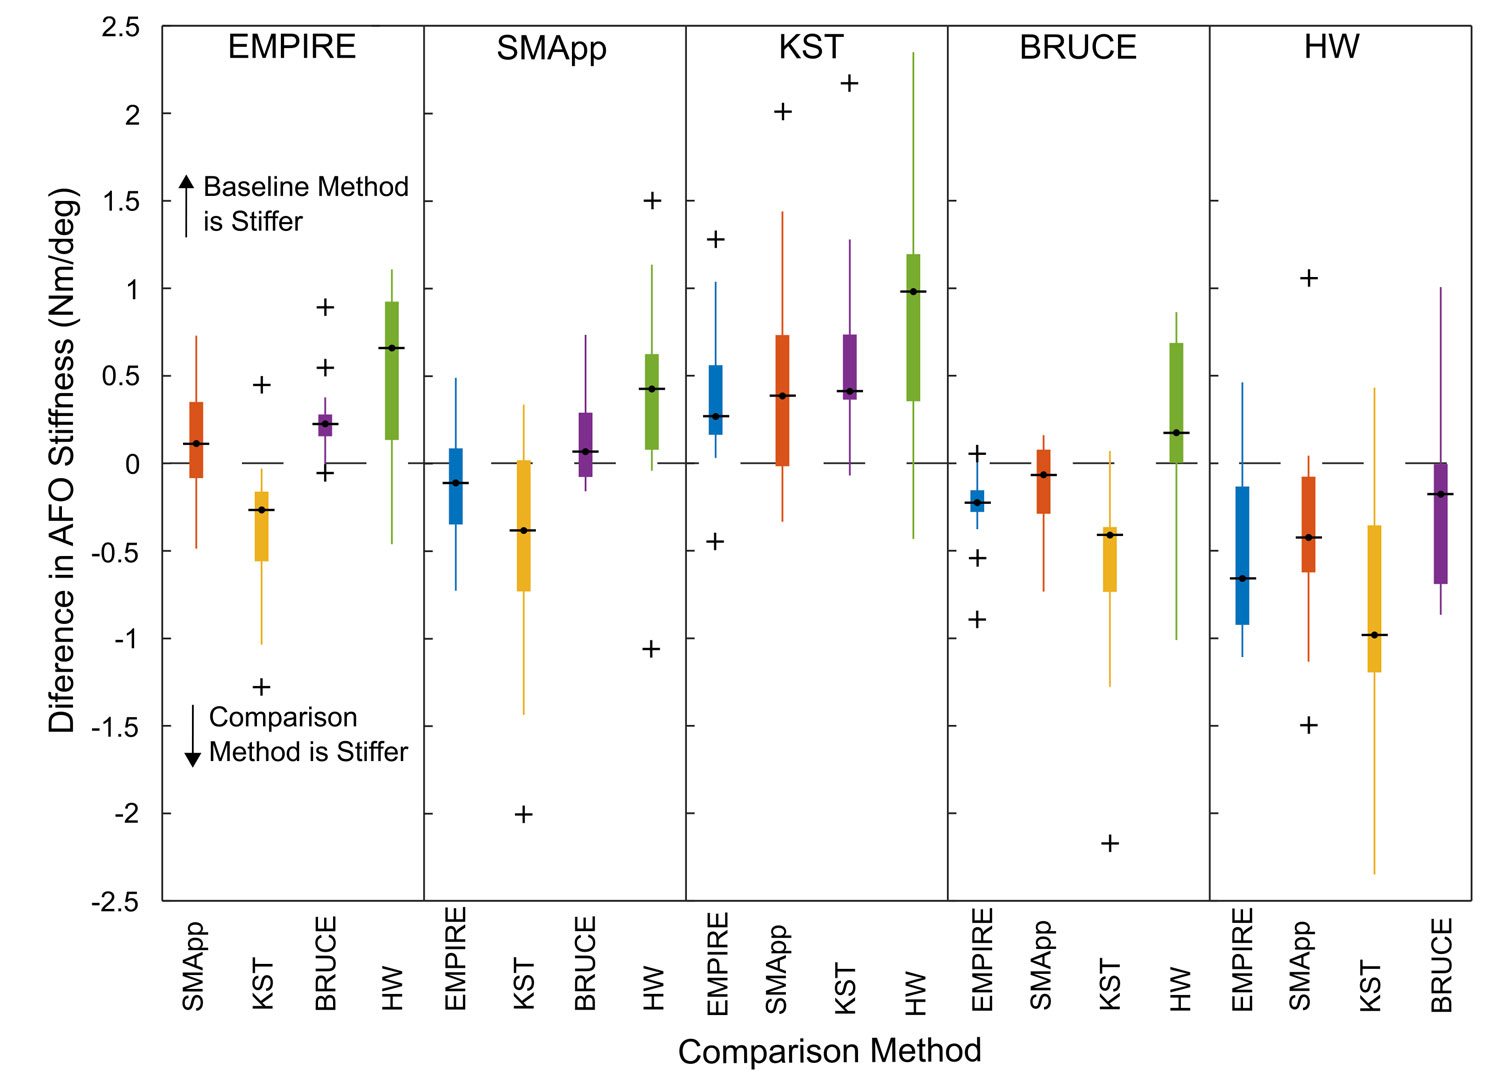
Figure 4. Box plot of differences in measured AFO stiffness between test methods. Each method is used as a baseline and compared to each of the other test methods, where the comparison method is indicated by color (blue: EMPIRE, red: SMApp, yellow; KST, purple: BRUCE, green: HW). Positive values indicate that the baseline method is stiffer than the comparison method. The KST measured stiffnesses are larger than any of the other test fixtures while the HW measured the lowest stiffnesses.
However, it is also still important to identify factors that can lead to consistency and inconsistency in testing outputs. Prior work has suggested that AFO users may be sensitive to differences in stiffness as small as 12%. Across the methods presented in this study we were only able to measure stiffness values that agreed within 15% of the average stiffness for 2 of the 13 AFOs tested, suggesting that if the goal of using stiffnesses to target AFO prescription is to be realized, uniform testing standards must be developed and adopted.
Conclusions
Quantitative measurements of the mechanical properties of AFOs promise to improve the prescription of AFOs by enabling direct comparisons across models and manufactures. However, this study highlights factors that may contribute to differences in testing outputs and demonstrates the fundamental importance of developing uniform testing standards, similar to those that exist for lower limb prosthetics. Lacking standardization, differences in fixturing and alignment practices may result in large differences in measured stiffness, limiting the potential clinical utility.

This article has been excerpted from “Comparison of five different methodologies for evaluating ankle-foot orthosis stiffness” by the same authors, which was published in the Journal of Neuroengineering and Rehabilitation. 2023;20(1):11. doi: 10.1186/s12984-023-01126-7. Editing has occurred, including the removal of tables, and references have been removed for brevity. Use is per CC Attribution 4.0 International License. Find the full article at https://jneuroengrehab.biomedcentral.com/articles/10.1186/s12984-023-01126-7.