 By Juliane Mueller, Monika Richter, Kathrin Schaefer, Jonathan Ganz, Jörg Lohscheller, and Steffen Mueller
In infants and young children, a wide heterogeneity of foot shape is typical. Therefore, children, who are additionally influenced by rapid growth and maturation, are a very special cohort for foot measurements and the footwear industry.
Although knowledge of the high heterogeneity in foot shape in children is evident, coupled with the influence of rapid growth and maturation of children, the footwear industry still bases the last as well as shoe development predominantly just on foot length and ball width. Yet children can have the same foot length but different foot shapes (eg, wide vs narrow). This fosters a mismatch between the manifold foot and shoe shapes.
New measurement techniques (3D foot scanning) allow the assessment of the individual foot shape. However, the validity in comparison to conventional methods remains unclear. Therefore, the purpose of this study was to compare 3D foot scanning with 2 established measurement methods (2D digital scanning and manual foot measurements).
Methods
The study cohort comprised 277 children (125 m/152 f; mean ± SD: 8.0 ± 1.5yrs; 130.2 ± 10.7cm; 28.0 ± 7.3kg). After collection of basic data (sex, age, body height, body weight), the geometry of the right foot was measured in static condition (stance) with 3 different measurement systems (fixed order): manual foot measurement, 2D foot scanning (2D desk scanner), and 3D foot scanning (handheld 3D scanner). Main outcomes were foot length, foot width (projected, anatomical, instep), heel width, and anatomical foot ball breadth. Analysis of variances for dependent samples was applied to test for differences between foot measurement methods (Post-hoc analysis: Tukey-Kramer-Test; α=0.05).
Results
Significant differences were found for all outcome measures comparing the 3 methods (P<0.0001). The span of foot length differences ranged from 3mm to 6mm with 2D scans showing the smallest and 3D scans the largest deviations. Foot width measurements in comparison of 3D and 2D scans showed consistently higher values for 3D measurements with the differences ranging from 1mm to 3mm. (Table 1.)
Discussion
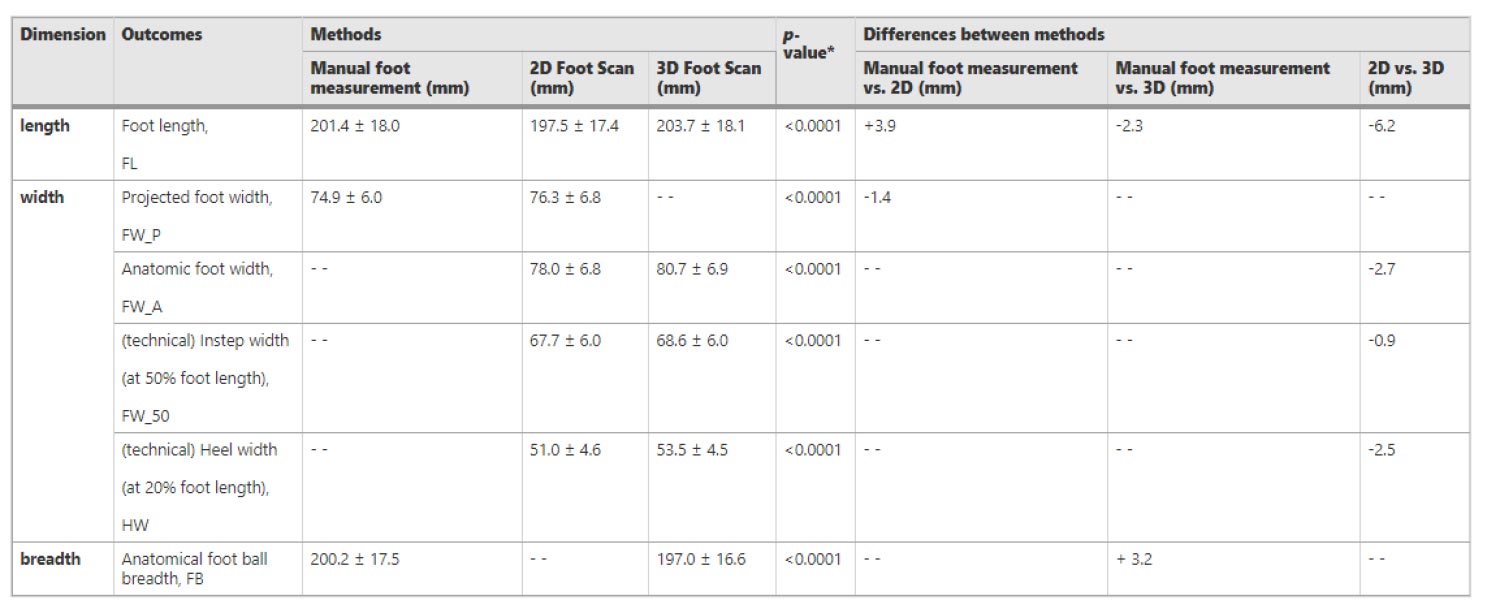
Table 1. Results for all outcome measures for all 3 foot measurement methods (mean ± SD and analysis of variances) and differences between foot measurement methods for all outcome measures
The study results show that the different methods somewhat under- and/or overestimate the single outcomes analyzed.
All foot dimensions collected with the 3D scanner were greater compared to 2D scanning as well as manual foot measurements. One reason could be that the 3D scanner detects the outermost points of the superficial boundaries (eg, metatarsal head) more precisely than the manual foot measurements or the 2D scan when measuring foot length, forefoot width, and heel width. Another reason may be that the examiner pressed the soft tissue surrounding the measuring points with the material of the slide during the manual foot measurement, which can result in smaller measurement values in foot length and/or width. The foot measures collected from the 2D scanning were smaller than those collected using manual measurement methods as well as 3D scanning. One reason for this might be because the shape of the human foot is curved upward at the outer (medial, lateral) edges and does not lie completely flat with the entire plantar surface. Because of this, the footprint on the scanner board might be reduced at the edge of the foot, and the foot scan contour captured tends to be smaller than the actual plantar surface contour. Consequently, a standardized measurement procedure is desirable, and adequate training for the examiner should be carried out before the use/application of the described measurement methods.
The 3D foot scanning is the technological gold standard for the assessment of foot morphology. The advantages of using the 3D scanning system to collect foot measures is the high precision and accuracy of the systems. The 3D foot scanning allows the assessment of volumetric and surface data and provides more detailed information on foot size and foot shape in all dimensions compared to manual measurement or 2D scanning. This is especially important for the growing foot of children. The high initial set-up cost as well as the time needed for processing the data (about 1–2 hours per scan) are disadvantages. Moreover, 3D scanning takes longer than manual foot measurement. However, the 3D measurements can be significantly accelerated by using a stationary camera measurement system placed around the foot instead of the handheld mobile scanner.
Conclusions
Based on the presented results, this study supports the use of 3D foot scanning measurement for collecting foot anthropometric data in school children 5–10 years old, especially as a basis for collecting detailed information on foot shape and size in all 3 dimensions for the last construction of children shoes. The findings suggest that when comparing foot data, it is important to consider the differences caused by new measurement methods. Differences of about 0.6cm are relevant when measuring foot length, as this is the difference of a complete shoe size. Hence, correction factors may be required to compare the results of different measurements appropriately. For application, it shows the importance that the measurement method for the feet should be in line with the measurement method of the shoe/last. Based on the presented (3D) data, a foot typing might be advantageous for further development of children shoe lasts that account for a higher number of foot shape variability in children.
This article has been excerpted from “How to Measure Children’s Feet: 3D Foot Scanning Compared with Established 2D Manual or Digital Methods,” J Foot Ankle Res 16, 21 (2023). https://doi.org/10.1186/s13047-023-00618-y. Editing has occurred, including the renumbering or removal of tables, and references have been removed for brevity. Use is per CC BY 4.0 International License.