
 By Mathias B. Forrester, BS
Background: Emergency medical services (EMS) calls accounted for 65.2% of all incidents to which United States (US) fire departments responded in 2023. A portion of fire department EMS calls are likely to involve lower extremity injuries. The objective of this study was to describe the pattern of these lower extremity injuries.
Methods: Data were obtained from the National Fire Incident Reporting System (NFIRS), which collects information on incidents to which US fire departments respond. Cases were lower extremity injuries managed by fire department EMS reported to NFIRS during 2014-2023. The distribution of cases was determined for patient characteristics, type of injury, and circumstances of injury.
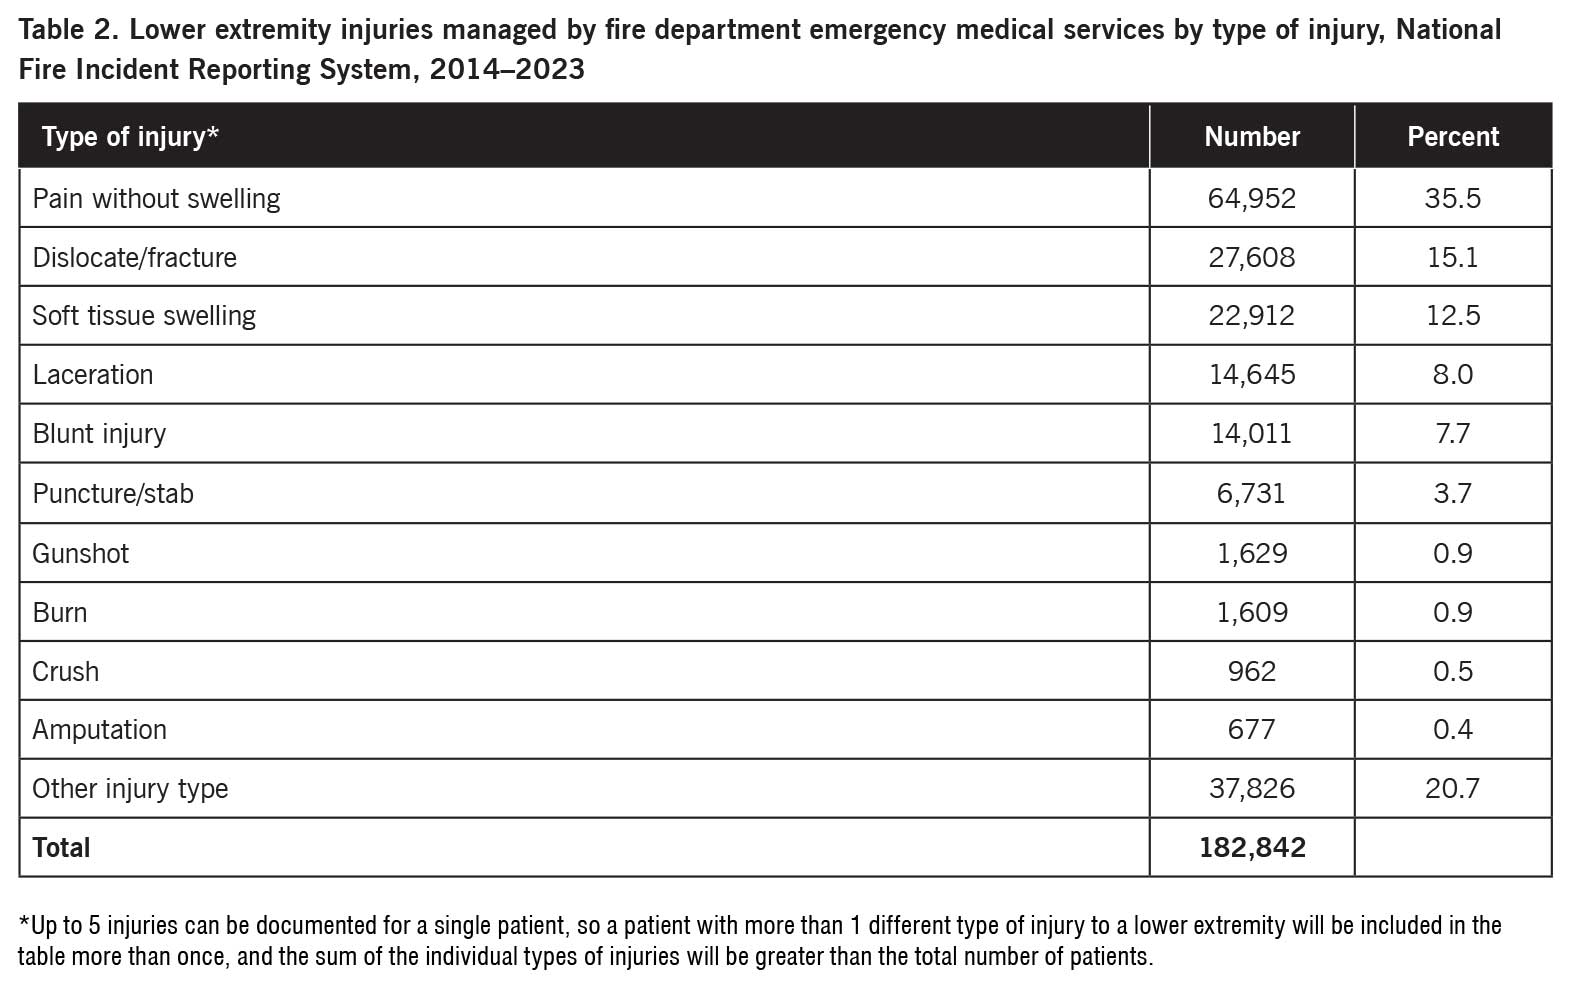
Results: A total of 182,842 records of lower extremity injuries managed by fire department EMS during 2014–2023 were identified, representing 1.1% of the total records. The symptoms were pain without swelling (35.5%), dislocation or fracture (15.1%), soft tissue swelling (12.5%), laceration (8.0%), blunt injury (7.7%), puncture or stab (3.7%), gunshot (0.9%), burn (0.9%), crush (0.5%), amputation (0.4%), and other type of injury (20.7%). The cause of the injury was fall (34.5%), motor vehicle accident (12.9%), motor vehicle accident (pedestrian) (3.1%), physical assault or abuse (1.5%), other (10.8%), and unknown or not documented (37.3%).
Conclusion: Thousands of lower extremity injuries were managed by US fire department EMS each year. The most common injuries were pain without swelling, dislocation or fracture, and soft tissue swelling. The most common causes of the injury were falls followed by motor vehicle accidents. The information in this study may be useful for creating strategies to manage lower extremity injuries to which EMS respond.
 According to the National Association of State Emergency Medical Services Officials (NASEMSO) 2020 National EMS Assessment, local emergency medical services (EMS) agencies respond to nearly 28.5 million 911 dispatches every year in 41 states in the United States (US).1 Furthermore, EMS calls accounted for 65.2% of all incidents to which US fire departments responded in 2023.2
A portion of fire department EMS calls are likely to involve lower extremity injuries. The objective of this study was to describe the pattern of these lower extremity injuries.
Methods
The data source for this study was the National Fire Incident Reporting System (NFIRS), which collects information on incidents to which US fire departments respond.3 Participation in NFIRS is voluntary, and not all fire departments participate.4,5 However, over 22,000 fire departments in all 50 states reported incident data to NFIRS as of 2023.3-5
Participating fire departments submit information to NFIRS on each incident to which they respond. The information provided includes the kind of incident, the location of the incident, the resources used to mitigate the incident, and other information to understand the nature and cause of the fire, hazardous material, or EMS incident.3,4 NFIRS consists of 11 modules (data subsets). Not all modules are completed for all incidents. Data from each participating fire department goes to the state agency responsible for NFIRS data. The state agency combines the data from all participating fire departments into a statewide database and then electronically sends the data to the US Fire Administration (USFA) National Fire Data Center (NFDC).4
Annually the USFA compiles publicly released NFIRS incident data that were collected by the states during the previous calendar year into a public data release (PDR) that is publicly available free of charge.6 Each annual database can be downloaded at:7 https://www.fema.gov/about/openfema/data-sets/fema-usfa-nfirs-annual-data.
Cases were lower extremity injuries managed by fire department EMS during 2014–2023. These injuries were identified using the NFIRS EMS Module. This is an optional module that is used when that option has been chosen by state or local authorities. The EMS Module is completed only if the fire department provides EMS. (If an independent provider performs EMS, this module is not used.) The purpose of the EMS Module is to gather data relating to the provision of emergency medical care. The module may be used by both responding EMS unit(s) and responding fire suppression unit(s) that provide EMS. This module does not include patient care information. The data collected in this module are incident based not patient based.4
 The EMS Module includes 5 numeric fields for documenting the Body Site of Injury (SITE_INJ1, SITE_INJ2, SITE_INJ3, SITE_INJ4, SITE_INJ5) and 5 numeric fields for documenting the associated Injury Type (INJ_TYPE1, INJ_TYPE2, INJ_TYPE3, INJ_TYPE4, INJ_TYPE5). A record was included in the study if any of the Body Site of Injury fields included the code for the lower extremity (7 – Lower extremities [includes legs and feet]). Thus, a given record included in the study could have as many as 5 different types of injury.
The distribution of cases was determined for patient characteristics, type of injury, and circumstances of injury. For those records where the patient age was >112 years [sic], the patient was included in the not documented subgroup.
Since the data are publicly available and de-identified, the study is exempt from institutional review board approval.
Results
A total of 182,842 records of lower extremity injuries managed by fire department EMS during 2014–2023 were identified, representing 1.1% of the 17,183,202 total records. Table 1 shows the distribution of the records by patient demographics. The number of patients tended to increase with patient age with 79,783 (43.6%) being aged 60 years or older. The majority of patients were female. Of those patients with a documented race, most were White. The patient’s ethnicity was 9,289 (5.1%) Hispanic, 92,734 (50.7%) non-Hispanic, and 80,819 (44.2%) not documented.
The annual number of reported lower extremity injuries managed by fire department EMS decreased from 26,522 in 2014 to 10,274 in 2020 and then increased to 14,618 in 2023. There were 42,985 (23.5%) reported injuries during December–February, 46,215 (25.3%) during March–May, 49,208 (26.9%) during June–August, and 44,434 (24.3%) during September–November. The number of injuries varied little by day of the week (data not shown). The states with the highest number of reported injuries were 27,811 (15.2%) Nevada, 18,870 (10.3%) California, 15,259 (8.3%) Florida, 10,298 (5.6%) Virginia, 9,020 (4.9%) Massachusetts, and 6,160 (3.4%) Minnesota.
When the distribution of lower extremity injuries managed by fire department EMS by type of injury was examined (Table 2), over one-third of the injuries involved pain without swelling. The next most common injuries were dislocation or fracture and soft tissue swelling. The cause of the injury was 63,015 (34.5%) fall, 23,506 (12.9%) motor vehicle accident, 5,694 (3.1%) motor vehicle accident (pedestrian), 2,691 (1.5%) physical assault or abuse, 19,710 (10.8%) other, and 68,226 (37.3%) unknown or not documented.
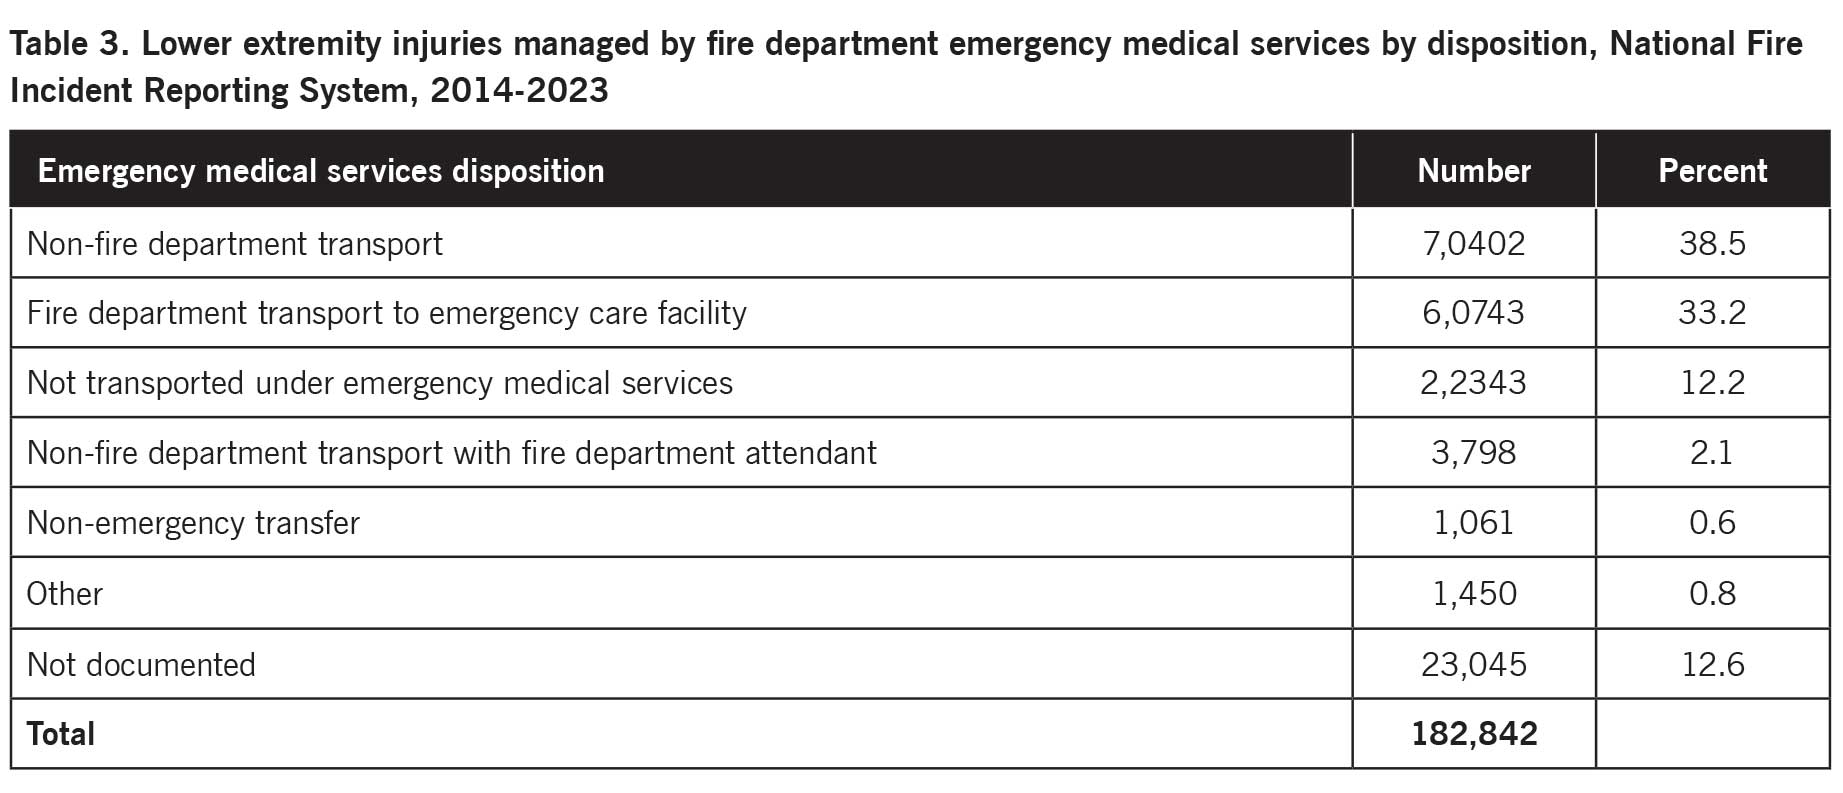 Table 3 presents the distribution of lower extremity injuries managed by fire department EMS by disposition. The most common disposition was non-fire department transport followed by fire department transport to emergency care facility and not transported under EMS.
Discussion
This study examined lower extremity injuries managed by US fire department EMS reported to NFIRS during 2014–2023. Although lower extremity injuries comprised only 1% of fire department EMS calls, they accounted for thousands of such calls each year.
The number of patients increased with patient age, and most patients were female. This study found that the highest proportion of lower extremity injuries were due to falls. Since falls and fall-related injuries are more common in older adults and females,8-11 falls may at least partially account for the observed age and sex pattern of lower extremity injuries. Alternately, older adults and females with lower extremity injuries may be more likely to request or receive fire department EMS assistance.
The annual number of reported lower extremity injuries managed by fire department EMS declined during 2014–2020 then increased through 2023. This annual pattern may suggest that the total number of lower extremity injuries that occurred or the tendency to contact fire department EMS about such injuries changed over time. Another possibility is that the number of fire departments with EMS that participated in NFIRS changed over time.
Nevada reported the highest number of lower extremity injuries managed by fire department EMS, followed by California, Florida, Virginia, Massachusetts, and Minnesota. This may be due to geographic differences in the risk of lower extremity injuries or the likelihood of contacting fire department EMS for lower extremity injuries. The geographic differences also may be due to geographic differences in the participation of fire departments with EMS, use of the optional EMS Module, or the proportion of EMS that are associated with fire departments versus independent providers.
The most common type of lower extremity injury was pain without swelling, accounting for 36% of the injuries. The next most common injuries were dislocation or fracture and soft tissue swelling. These types of injuries generally might not be expected to require extensive medical intervention. This study found that the most common disposition was non-fire department transport followed by fire department transport to emergency care facility and not transported under EMS.
Falls accounted for 34% of the injuries, with motor vehicle accidents accounting for an additional 13%. Any changes in the rates of falls or motor vehicle accidents would likely affect the number of lower extremity injuries managed by fire department EMS.
This study has various limitations. Participation in NFIRS is voluntary. Furthermore, the EMS Module is an optional module and is used when that option has been chosen by state or local authorities. Also, the NFIRS EMS Module is not used if an independent provider performs EMS. Thus, the NFIRS database does not include all injuries where EMS is involved.4,5 This needs to be considered in the analysis of certain variables, such as geographic region.
In addition, an injury may involve multiple symptoms and/or multiple body parts. Each record only documents up to 5 body sites of injury and associated injury type. If an individual experiences more than 5 injured body parts and/or types of injury, some of the injuries will not be documented in NFIRS. Also, the Body Site of Injury numeric field only includes a single code for the lower extremity; the field does not include separate codes for more specific parts of the lower extremity (eg, knee, ankle, foot).
In conclusion, this study found that thousands of lower extremity injuries were managed by US fire department EMS each year. The most common injuries were pain without swelling, dislocation or fracture, and soft tissue swelling. The most common causes of the injury were falls followed by motor vehicle accidents. The information in this study may be useful for creating strategies to manage lower extremity injuries in EMS calls.
Mathias B. Forrester, BS, is an independent researcher in Austin, Texas. Now retired, he has performed public health research for various university and government programs for 40 years.
- EMS1. National Association of State EMS Officials releases stats on local agencies, 911 calls. EMS1.com. April 10, 2020. Available at https://www.ems1.com/ambulance-service/articles/national-association-of-state-ems-officials-releases-stats-on-local-agencies-911-calls-LPQTHJrK2oIpxuR1/. Accessed May 28, 2025.
- U.S. Fire Administration. Statistics. U.S. fire department responses (2023). Available at https://www.usfa.fema.gov/statistics/. Accessed May 28, 2025.
- U.S. Fire Administration. National Fire Incident Reporting System. October 9, 2024. Available at https://www.usfa.fema.gov/nfirs/. Accessed May 28, 2025.
- U.S. Fire Administration. National Fire Incident Reporting System Complete Reference Guide. January 2015. Available at https://www.usfa.fema.gov/nfirs/documentation/. Accessed May 28, 2025.
- The National Fire Incident Reporting System and the Public Data Release File. NFIRS and PDR Overview 2023. In the 2023 All Incidents data download.
- U.S. Fire Administration. Access NFIRS Data. October 17, 2024. Available at https://www.usfa.fema.gov/nfirs/access-data/. Accessed May 28, 2025.
- Federal Emergency Management Agency. Annual NFIRS Public Data. Available at https://www.fema.gov/about/openfema/data-sets/fema-usfa-nfirs-annual-data. Accessed May 28, 2025.
- Verma SK, Willetts JL, Corns HL, Marucci-Wellman HR, Lombardi DA, Courtney TK. Falls and fall-related injuries among community-dwelling adults in the United States. PLoS One. 2016;11(3):e0150939.
- Mertz KJ, Lee DC, Sui X, Powell KE, Blair SN. Falls among adults: the association of cardiorespiratory fitness and physical activity with walking-related falls. Am J Prev Med. 2010;39(1):15-24.
- Kung HC, Hoyert DL, Xu J, Murphy SL. Deaths: final data for 2005. Natl Vital Stat Rep. 2008;56(10):1–120.
- Centers for Disease Control and Prevention (CDC). Public health and aging: nonfatal injuries among older adults treated in hospital emergency departments – U.S., 2001. MMWR Morb Mortal Wkly Rep. 2003;52(42):1019–1022.


My uncle was a fireman. He used to take me on calls to people’s houses for falls and heart attacks. It was so amazing to see these first responders at work.
https://www.atlasbiomechanics.com/heel-lifts-s/1821.htm