 By Jay Segel, DPM, & Sally Crawford, MS
New technology allows new findings
Stack height is the amount of material between one’s foot and the ground. As stack height, by definition, speaks to the amount of organized material between a 3-dimensional foot of limited mass and the relatively unlimited mass of any 2-dimensional support surface on which it functions, it will have a considerable and primary effect on gait and balance. Research has presented us with at least 2 different perspectives on the impact of stack height on walking biomechanics. First, stack height accomplished with forgivable material has been positively associated with shock absorption and recovery, but second, also with instability, moving the foot vertically away from its base of support. Given the recommendation for continued intervention between a vulnerable foot and its support surface, our objective was to examine what Computer-Aided Gait Analysis (CAGA) can tell us about the impact of stack height in some of today’s “recovery” sandals, namely OOfos® OOmega OOlala sandals and the brand’s OOriginal sandal.
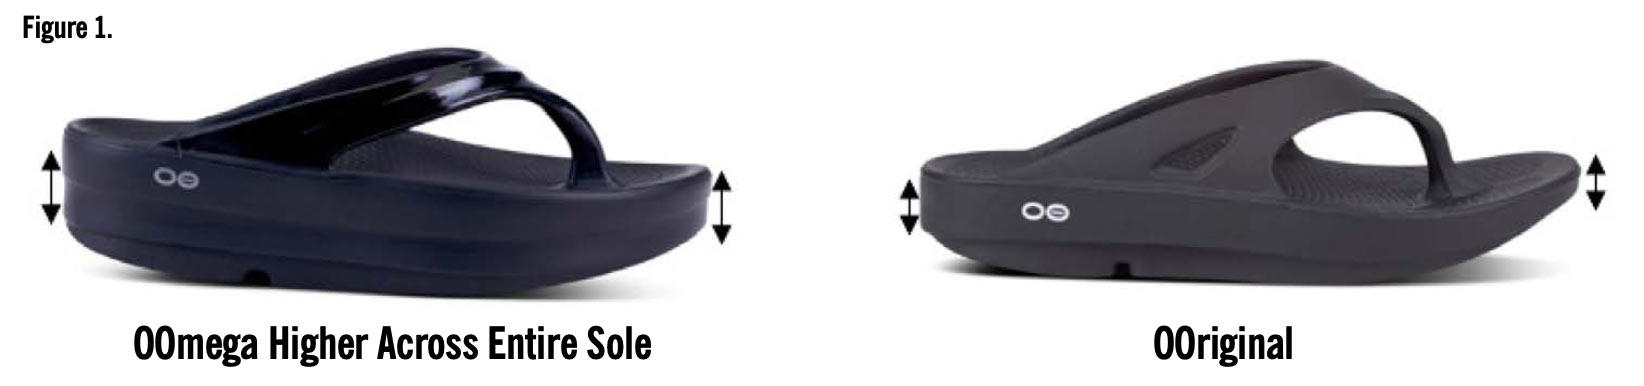
OOfos’ 2022 women’s model of OOmega OOlala sandals adds a mega midsole, giving it a significantly higher height across the entire sole, whereas stack height for the women’s OOriginal is much less (Figure 1). An elevated stack height is postulated to contribute to shock absorption with limited change in biomechanical accommodation. Prior studies have shown that stack height does not correlate to impact mechanics,1 so verifying this as well as expanding upon the investigation to understand more regarding stability of the different OOfos’ sandals is of interest.
What We Did
All walking tests were completed on a medical grade, outfitted treadmill. Gait, temporospatial, and center of pressure parameters and graphs were obtained using the research grade Zebris FDM-T Treadmill (Zebris1 Medical GmbH, Germany) fitted with an under-belt platform consisting of 10,240 force sensors, each approximately 1 cm × 1 cm. During walking and standing reactive-normal force in directions x, y and z are recorded by the sensors at a sampling rate of 120 Hz. Due to the high density of the sensors, the foot is mapped at a high resolution to facilitate even subtle changes in force distribution. Timing can also be monitored and standardized in a fashion allowing adequate repeat testing. Within-day reliability testing on the system is 5% or less.2 Dedicated Noraxon MyoResearch Software 3.20 running dynamic hardware configurations in expert 10 zone expert mode, integrated the force signals and provides 2D/3D graphic representation. Additionally, synchronized to the pressure outfitted treadmill were 2 streaming slow-motion high-definition cameras (Logitech C 920).
With the gait raw force data that was available, normalized gait cycle force curves were possible to construct, representing an average summary of every tested step as well as variability between the steps. Using the analyzed metrics from the average of each step, left and right calculations of all parameters were possible, enabling comparisons, side-to-side, and variability within each parameter between steps.3,4
All computer-aided gait parameters were compared between 30-second walking tests in OOmega (n=20) and OOriginal sandals (n=20) (100% female, with mean age 31.5yrs +/- 15). Paired sample t-tests were used to compare the means of gait parameters between the tests. The t-test is a method that determines whether 2 population conditions are statistically different from each other.
Mean percentage differences in gait parameters and p-values were computed for each gait parameter variable to assess the statistically significant gait parameters. All the variables that yielded a p-value of <0.05 were noted as statistically significant.
Key Findings
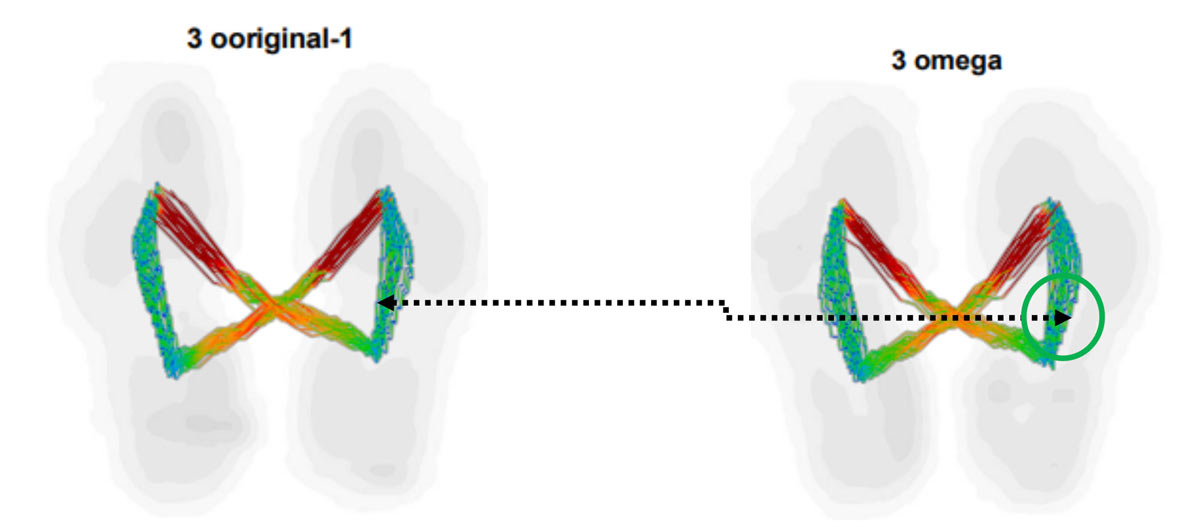 Spatial Stability: OOmega walking averages for the anterior/posterior axis of the center of gravity cross-over resulted in a more posterior cross-over point (p=0.02794) with improved consistency of this point through all walking trials (p=0.0427) (Figure 2). One might postulate that the reverse would be expected given findings of walking in heels or elevated woman’s wedges. In raised woman’s shoes, pressures are shifted to the forefoot. A more anterior pressure position is typically noted with forward leaning, forefoot dominance (not great on the metatarsals) or footwear with high rocker, speed boards, or forefoot propulsive technology; none of which is included in OOfos footwear. Given OOmegas had a statistically significant posterior cross-over point, the reverse is true, and an improved heel-to-toe pattern of loading was encouraged given the stack was consistent across entire sole.
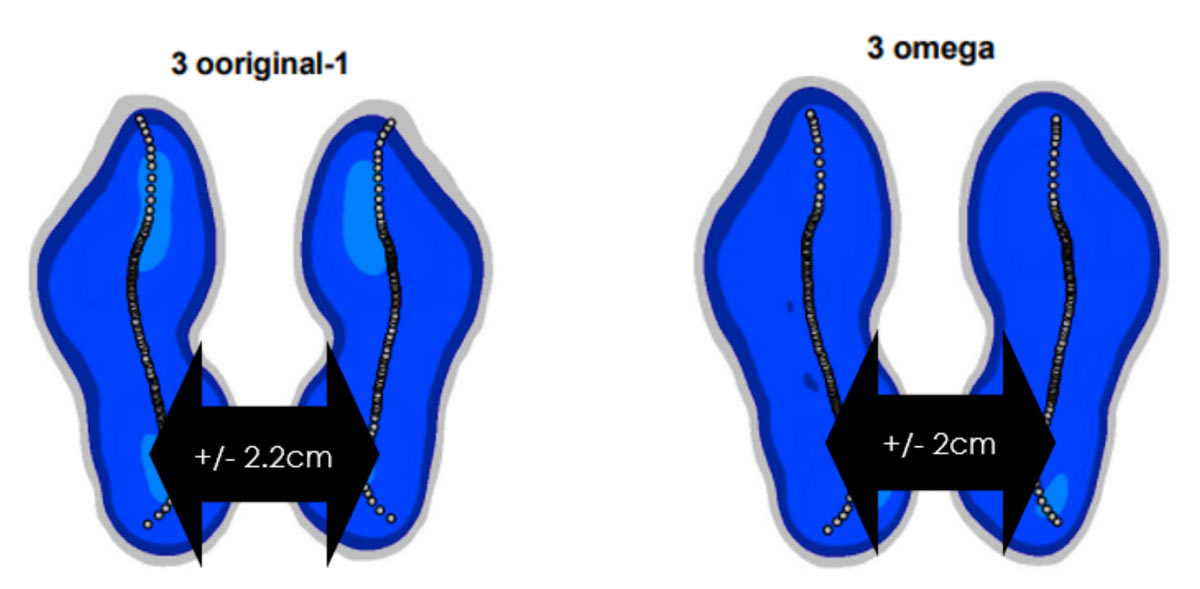
The step-to-step changes in base of support, or step width variability, resulted in significant decreases with OOmega (p=0.037214; Figure 3). Null hypothesis for step width was rejected but accepted for variability. Unchanged step width measures with improved variability between strides indicates more stable transitions.
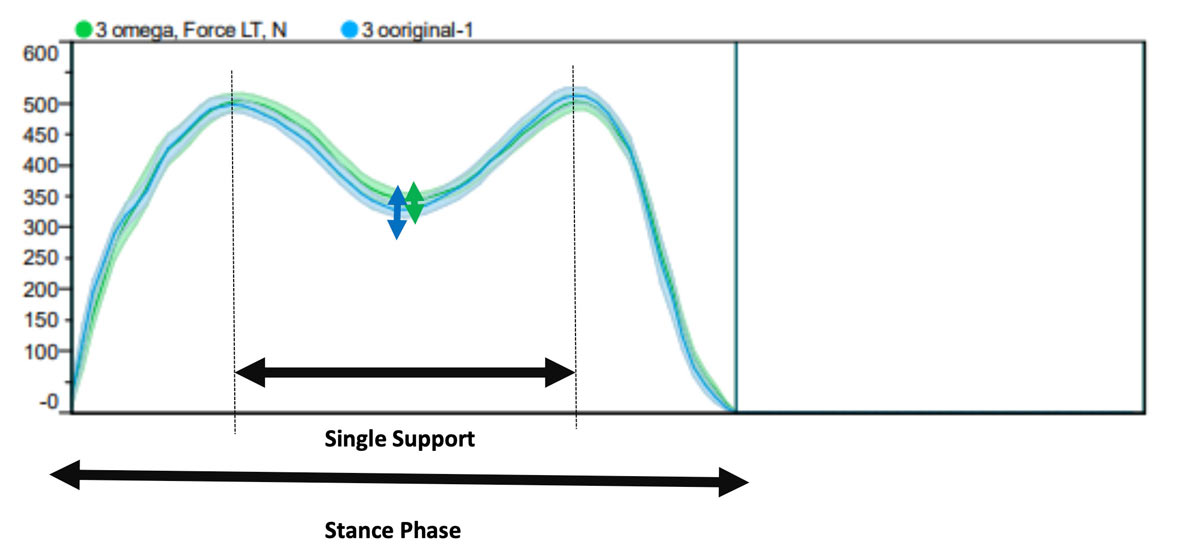
Kinetic Stability: A reduced variability in force through single support phase of gait was measured in OOmega walking tests, indicating no loss in stability with OOmega sandals (p=0.043046 for left and p=0.067596 for right). (Figure 4)
 There was no significant difference in length of the single support phase or stance phase, which helps pinpoint difference only to variability. The null hypothesis was rejected and phasic patterns remained the same between models with both stack height measures.
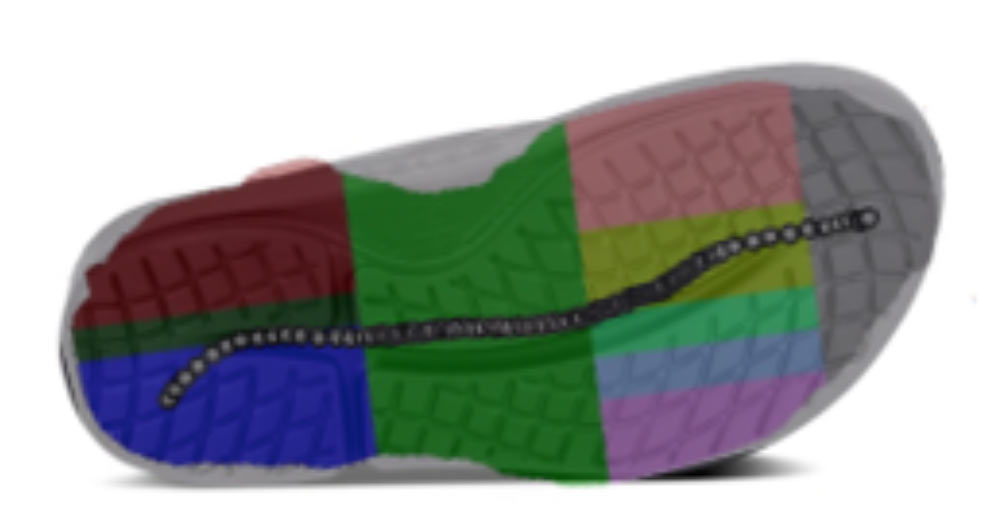
Timing of Gait: Further comparative evaluation makes evident another set of findings that includes improved duration and timing of gait events while walking in OOmega sandals (Figure 5). The start times and peak pressure percent through the forefoot resulted in significant outcomes. The initial point in the gait cycle when pressure commenced in the forefoot zones (pink, yellow, light green, light blue, and purple) began later in the gait cycle through walking trials in OOmega (p< 0.02) which is consistent with enhanced gait patterns.
Duration, or amount of time in the gait cycle spent in each zone where the sole’s surface is in contact with the treadmill, was significantly decreased, however. The most significant duration reduction was through the central region of the forefoot (light green), more specifically where the 3rd metatarsal head might engage OOfos’ patented OOfoamTM (p<0.001). A shorter duration may relate to changed roll through mechanisms and potentially shorter durations of pronation. A more optimal shock absorption sandal might tend to create shorter, decreased, or more economical durations through the sole. This decreased duration was revealed in this study with great statistical significance.
The only zone where this was not the case was the left lateral heel. The result is interesting as it manifested only in the left lateral heel, not the right. The side difference found across the 20 trials may be indicative of increased duration of shock absorption provided by the OOmegas, and thus also suggests accommodation for potential limb length discrepancies of a shorter left side, irrelevant to the category or function through walking (closed chain kinematics).
 Lateral heel impact position speaks to improved pronation to absorb shock and typically the left pronation is lacking when compared to right, the usual culprit being right hip tightness. There may be a beneficial accommodative aspect that is enhanced with the increased stack height and OOfoam material mechanics through the heel. Previously, we described that “patients with [limb length discrepancy] are expected to exhibit a compensated (weight-bearing) long-leg pattern during gait, typically visualized as foot abduction, pronation, and dorsiflexion.”5 We know that if your right hip is tighter, it could potentially cause your right foot to turn outwards more. This is because the way our hips move and align can directly affect how our legs and feet position themselves. So, no matter the stem of the issue the additional height of the OOmega manages the outcome.
Assessment & Intervention Outcomes
In conclusion, OOmega sandals did not encourage center of gravity instability when examining spatial gait parameters. Walking in OOmega sandals does not rock center of gravity forward or significantly lateral; instead distance and variability of center-point between steps decreases.
In terms of kinetics, the off-loading and force variability through single support phase in OOmegas was reduced, indicating that more stable mechanics were encouraged. No changes in length of single support or stance phase were measured, nor variability of stance. These similarities help validate that the OOmega sandals may encourage smoother, more stable, single support force transitions, without impacting the rest of the gait cycle.
 Lastly, forefoot sandal sole ground mechanics were enhanced based on timing and duration through the metatarsals and off the toe in OOmega sandals. Walking in OOmega sandals shifted pressure initiation later in the gait cycle, even as propulsion off toes and differences in stance were negligible. There was increased duration and impulse through the lateral heel portion of sole. Such pronation at contact helps manage ground reaction forces and thanks to the added shock absorbing material through the sole of the OOmega sandals, this is an advantageous difference in walking gait when compared to OOriginal.

Jay Segel, DPM, is a Podiatrist, Biomechanist, Orthotic and Gait Analysis Specialist, in Martha’s Vineyard, MA.
Sally Crawford, MS, is a Biomedical Engineer, technology expert and data manager in Omaha, NE.
- Matias A, Outerleys J, Johnson C, Sacco ICN, Davis IS. Correlations between stack height differences in minimal shoes and impact loading. Footwear Science. 2019;11(Sup1):S196-S198. DOI: 10.1080/19424280.2019.1606330.
- Faude O, Donath L, Roth R, Fricker L, Zahner L. Reliability of gait parameters during treadmill walking in community-dwelling healthy seniors. Gait Posture. 2012;36(3):444-8. doi: 10.1016/j.gaitpost.2012.04.003.
- Exell TA, Irwin G, Gittoes MJR., Kerwin DG. Implications of intra-limb variability on asymmetry analyses. J Sports Sci. 2012; 30(4):403-409. https://doi.org/10.1080/02640414.2011.647047.
- Twisk J, Proper K. Evaluation of the results of a randomized controlled trial: how to define changes between baseline and follow-up. J Clin Epidemiol. 2004;57(3):223-8. doi: 10.1016/j.jclinepi.2003.07.009.
- Segel J, Sanford S, Crawford S, Yarrow L. Assessing Limb Length Discrepancy. Lower Extremity Review. 2018;10(2):16-34.