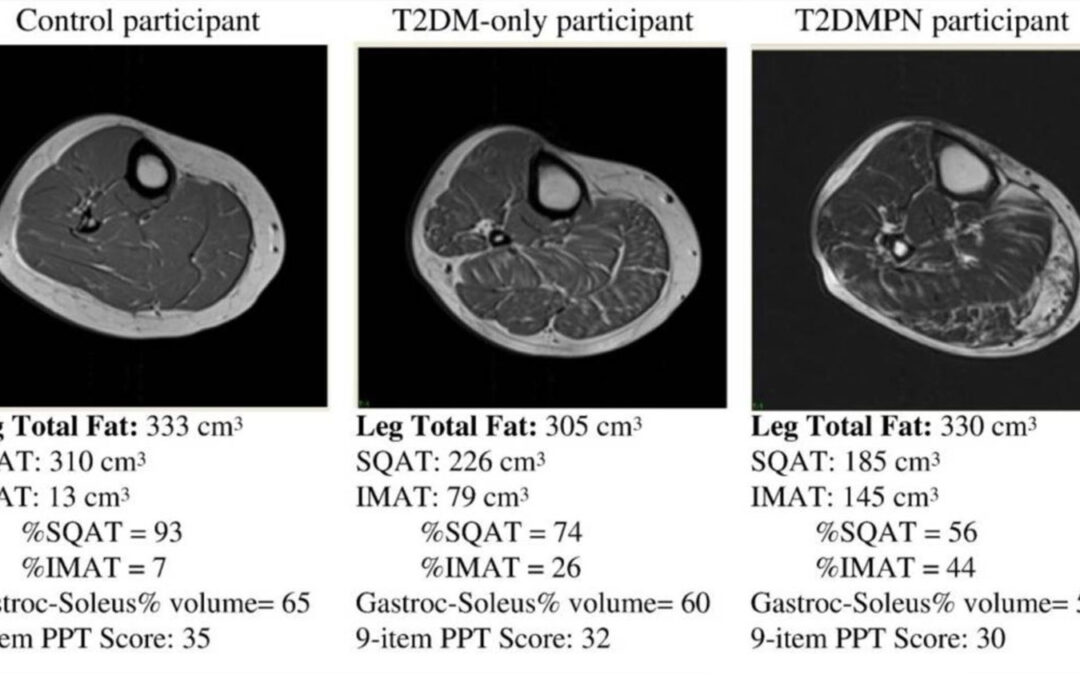
T1 cross-sectional images of the legs of a control, a patient with Type 2 diabetes (T2DM), and a Type 2 diabetes patient with peripheral neuropathy (T2DMPN). These images exemplify the progression of obesity (control) to T2DMPN and the accompanying loss of subcutaneous adipose tissue (SQAT), accumulation of leg intermuscular adipose tissue (IMAT), loss of muscle volume (gastroc-scoleus% vol.), and reduced physical function as assessed by the Physical Performance Test (PPT). Reprinted from Bittel DC, Bittel AJ, Tuttle LJ, et al. Adipose tissue content, muscle performance and physical function in obese adults with type 2 diabetes mellitus and peripheral neuropathy. J Diabetes Complications. 2015;29(2):250-7. doi: 10.1016/j.jdiacomp.2014.11.003. Reprinted with permission from Elsevier. All rights reserved.
Visualizing Declining Muscle Quality
URL has been copied successfully!