 By Mathias B. Forrester, BS
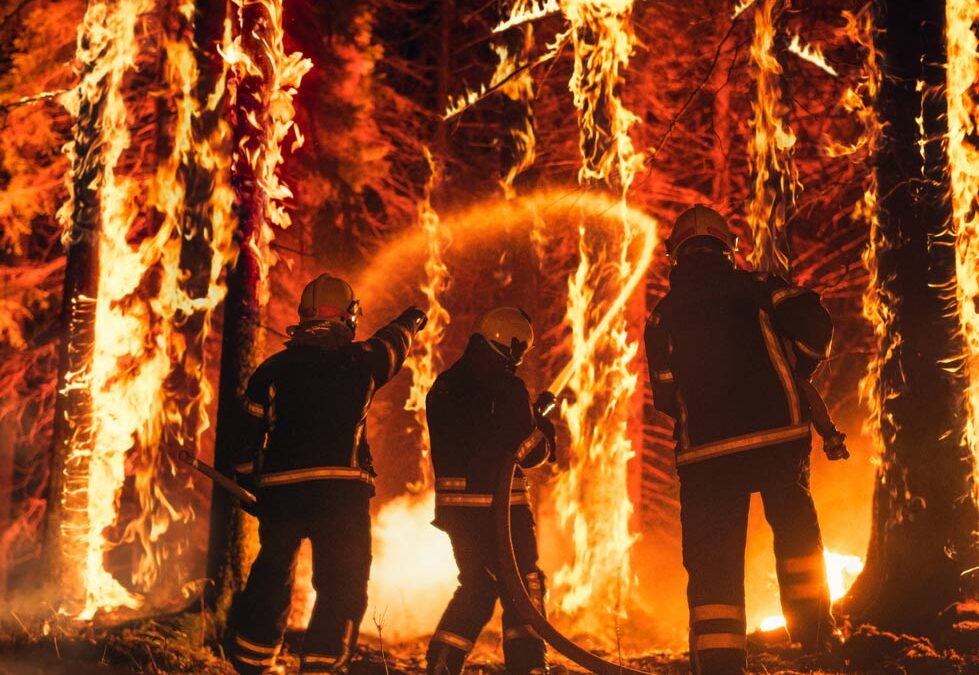
Background: In 2020, there were over 1 million career and volunteer firefighters in the United States (US). Thousands of injuries involving firefighters occur annually. The body part involved in the highest proportion of injuries is the lower extremity. The objective of this study was to characterize firefighter lower extremity injuries in the US.
Methods: Data were obtained from the National Fire Incident Reporting System (NFIRS), which collects information on incidents to which fire departments respond in the US. Cases were firefighter lower extremity injuries reported to NFIRS during 2014–2023. The distribution of cases was determined for type of injury, patient characteristics, and circumstances of injury.
Results: A total of 20,987 records of firefighter lower extremity injuries were reported to NFIRS during 2014–2023. The distribution of the injuries by body part was 43.6% knee, 25.6% ankle, 13.8% lower leg, 10.3% foot and toes, and 6.7% upper leg. The most commonly reported injuries were 48.1% strain or sprain, 20.3% pain only, 7.2% swelling, and 5.3% contusion or bruise (minor trauma). The severity of 64.9% of the injuries was classified as report only, first aid only, and treated by physician (not a lost-time injury); 35.0% of the injuries were classified as lost-time injuries or death. The location where the patient was treated was 41.6% not transported, 27.2% hospital, 7.6% doctor’s office, 5.4% station or quarters, 2.0% other or undetermined, and 16.3% not documented.
Conclusion: Several thousand firefighter lower extremity injuries occur each year in the US. However, most of these injuries are not likely to be severe and may be managed outside of a hospital. The information in this study may be useful for creating strategies to prevent firefighter lower extremity injuries.
 Firefighting is a difficult job handled on both paid career and volunteer levels. According to the National Fire Prevention Association (NFPA) Survey of Fire Departments for US Fire Experience, during 2020, there were 29,452 fire departments in the United States (US) in 2020. In that same year, there were an estimated 1 million career and volunteer firefighters.1
During 2018–2020, there was an estimated average of 61,325 firefighter injuries annually. The firefighters were injured while performing fire suppression activities (at the location of the fire or fireground), responding to or returning from an incident (including fire and nonfire emergencies), working at on-scene nonfire emergencies (includes rescues, hazardous calls, and natural disaster calls), training, and participating in other on-duty activities (eg, inspection or maintenance duties). The most common causes of injuries were overexertion or strain (29%), exposure to hazard (17%), contact with object (13%), fall (12%), and slip or trip (11%). Twenty-one percent of the injuries involved the lower extremity; the lower extremity accounted for the highest proportion of injuries of any body part.2
The objective of this study was to characterize firefighter lower extremity injuries in the US.
Methods
Data for this retrospective epidemiological study were obtained from the US Fire Administration (USFA) National Fire Data Center (NFDC). The NFDC collects information on incidents to which fire departments respond in the National Fire Incident Reporting System (NFIRS).3 Participation in the NFIRS is voluntary, and not all US fire departments participate.4,5 However, as of 2023, over 22,000 US fire departments in all 50 states reported incident data to NFIRS.3-5
Participating fire departments submit information to NFIRS on all incidents to which they respond.3,4 The information provided describes the kind of incident to which they responded, the location of the incident, the resources used to mitigate it, and other information to understand the nature and causes of the fire, hazardous material, and emergency medical service (EMS) incidents. Information is also collected on civilian or firefighter casualties and an estimate of property loss.4 NFIRS consists of 11 modules (data subsets). Not all modules are completed for all incidents. Information is first sent to local agencies, who then forward the completed NFIRS formation to the state agency responsible for NFIRS data. The state agency combines the information with data from other fire departments into a statewide database and then electronically sends the data to the NFDC at the USFA.4
Each year the USFA compiles publicly released NFIRS incident data that were collected by the states during the previous calendar year into a public data release (PDR) that is available free of charge.6 Each annual database can be downloaded at:7 https://www.fema.gov/about/openfema/data-sets/fema-usfa-nfirs-annual-data.
 Cases were firefighter lower extremity injuries reported during 2014–2023. Injuries involving firefighters were identified using the NFIRS Fire Service Casualty Module, which is used to report all injuries, deaths, or exposures to fire service personnel. This includes casualties that occur in conjunction to both incident responses and non-incident events such as station duties or training. A separate Fire Service Casualty Module is required for each casualty or health exposure. Lower extremity injuries were identified by searching the Fire Service Casualty Module for those records where the Primary Area of Body Injured (PABI) numeric field included codes for the lower extremity: 71 – Leg, upper; 72 – Leg, lower; 73 – Knee; 74 – Ankle, and 75 – Foot and toes. It should be noted that each record only documents a single primary symptom and the associated body part.
The distribution of cases was determined for type of injury, patient characteristics, and circumstances of injury. Some of the documented ages were considered inaccurate (eg, age less than 10 years, age greater than 100 years), so ages less than 18 years or greater than 85 years were grouped in the unknown category.
Since the data are publicly available and de-identified, the study is exempt from institutional review board approval.
Results
A total of 20,987 records of firefighter lower extremity injuries were reported to NFIRS during 2014–2023. The distribution of the injuries by body part was 9,151 (43.6%) knee, 5,378 (25.6%) ankle, 2,896 (13.8%) lower leg, 2,152 (10.3%) foot and toes, and 1,410 (6.7%) upper leg.
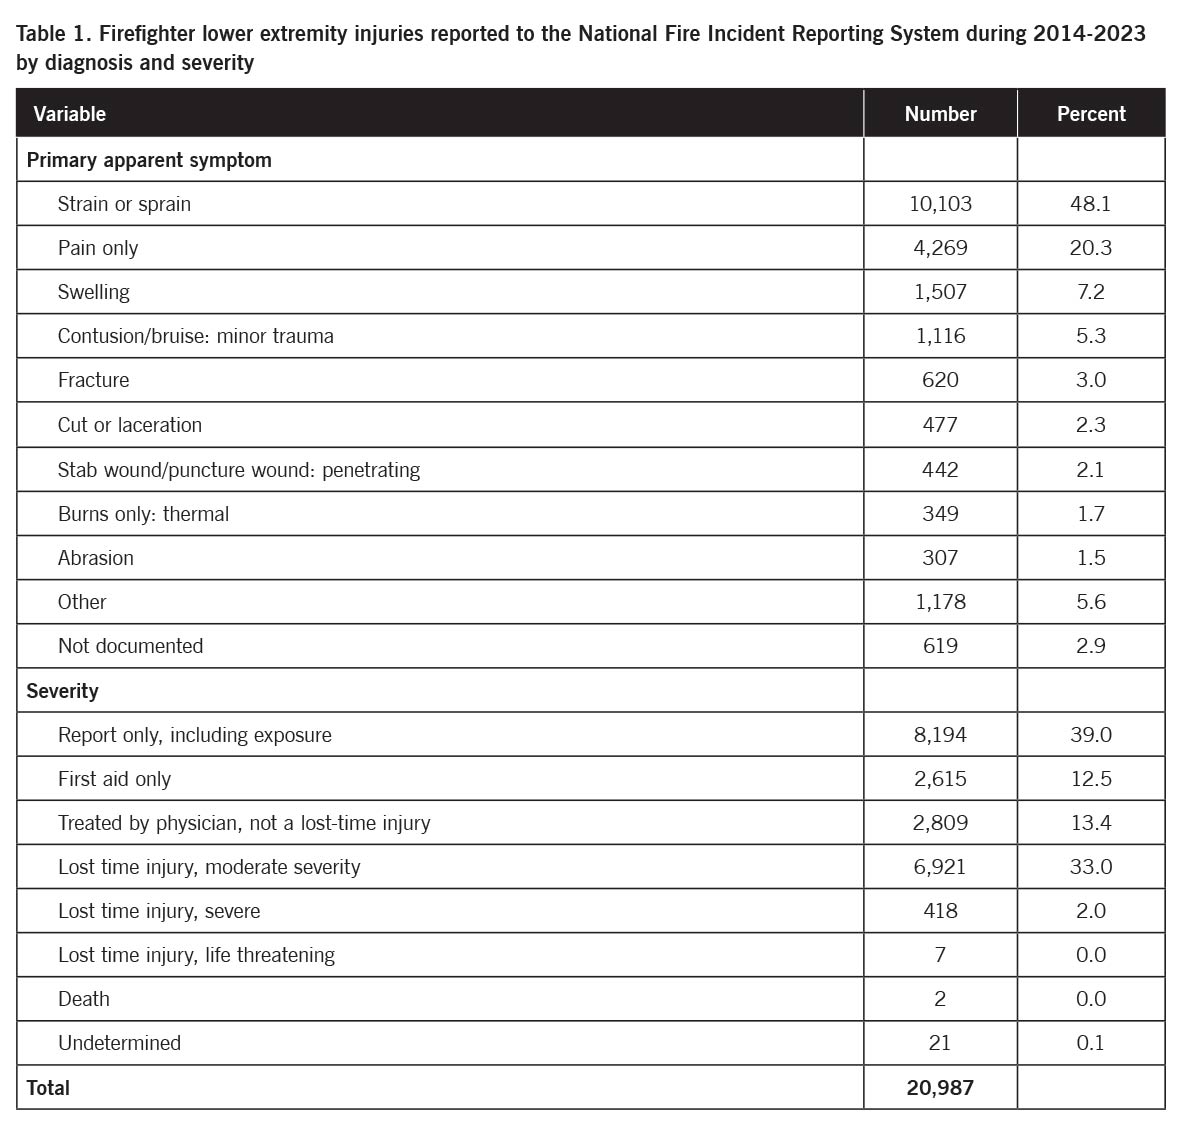
Table 1 provides the distribution of firefighter lower extremity injuries by diagnosis and severity. The most reported lower extremity injuries were strain or sprain, pain only, swelling, and contusion or bruise (minor trauma), accounting for 81.0% of all lower extremity injuries. For 64.9% of the injuries, the severity was classified as report only, first aid only, and treated by physician (not a lost-time injury); for 35.0% of the injuries, the severity was classified as lost-time injuries or death. The location where the patient was treated was 8,723 (41.6%) not transported, 5,698 (27.2%) hospital, 1,598 (7.6%) doctor’s office, 1,128 (5.4%) station or quarters, 429 (2.0%) other or undetermined, and 3,411 (16.3%) not documented.
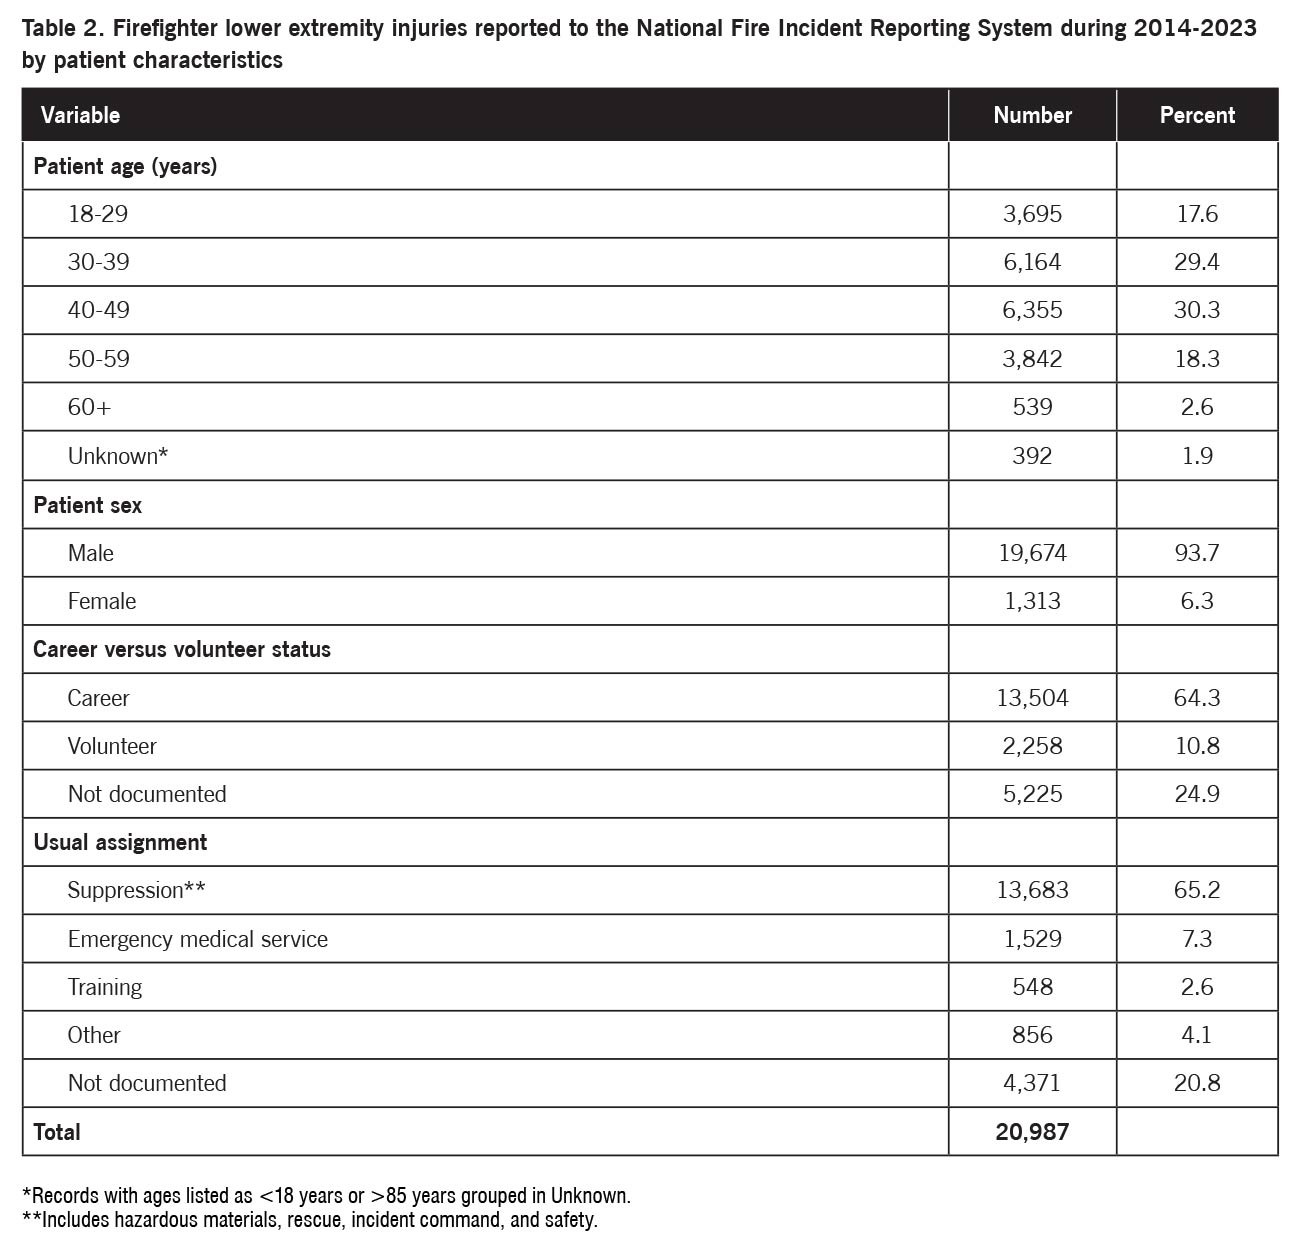
Table 2 shows the distribution of firefighter lower extremity injuries by patient characteristics. Most (59.7%) of the firefighters were age 30–49 years, and the majority of firefighters were male. Most of the firefighters were career firefighters, and the majority of firefighters were assigned to fire suppression, followed by emergency medical services.
The annual number of reported firefighter lower extremity injuries ranged between 2,124 and 2,409 (annual mean 2,265) during 2014–2019 and 1,825 and 1,889 (annual mean 1,850) during 2020–2023. There were 5,885 (28.0%) reported injuries during January–March, 5,226 (24.9%) during April–June, 5,142 (24.5%) during July–September, and 4,734 (22.6%) during October–December. There was little variation by day of the week (data not shown). The states with the highest number of reported injuries were 1,947 (9.3%) Massachusetts, 1,773 (8.4%) Ohio, 1,599 (7.6%) Florida, 1,469 (7.0%) Illinois, 1,097 (5.2%) New York, and 1,077 (5.1%) Texas.
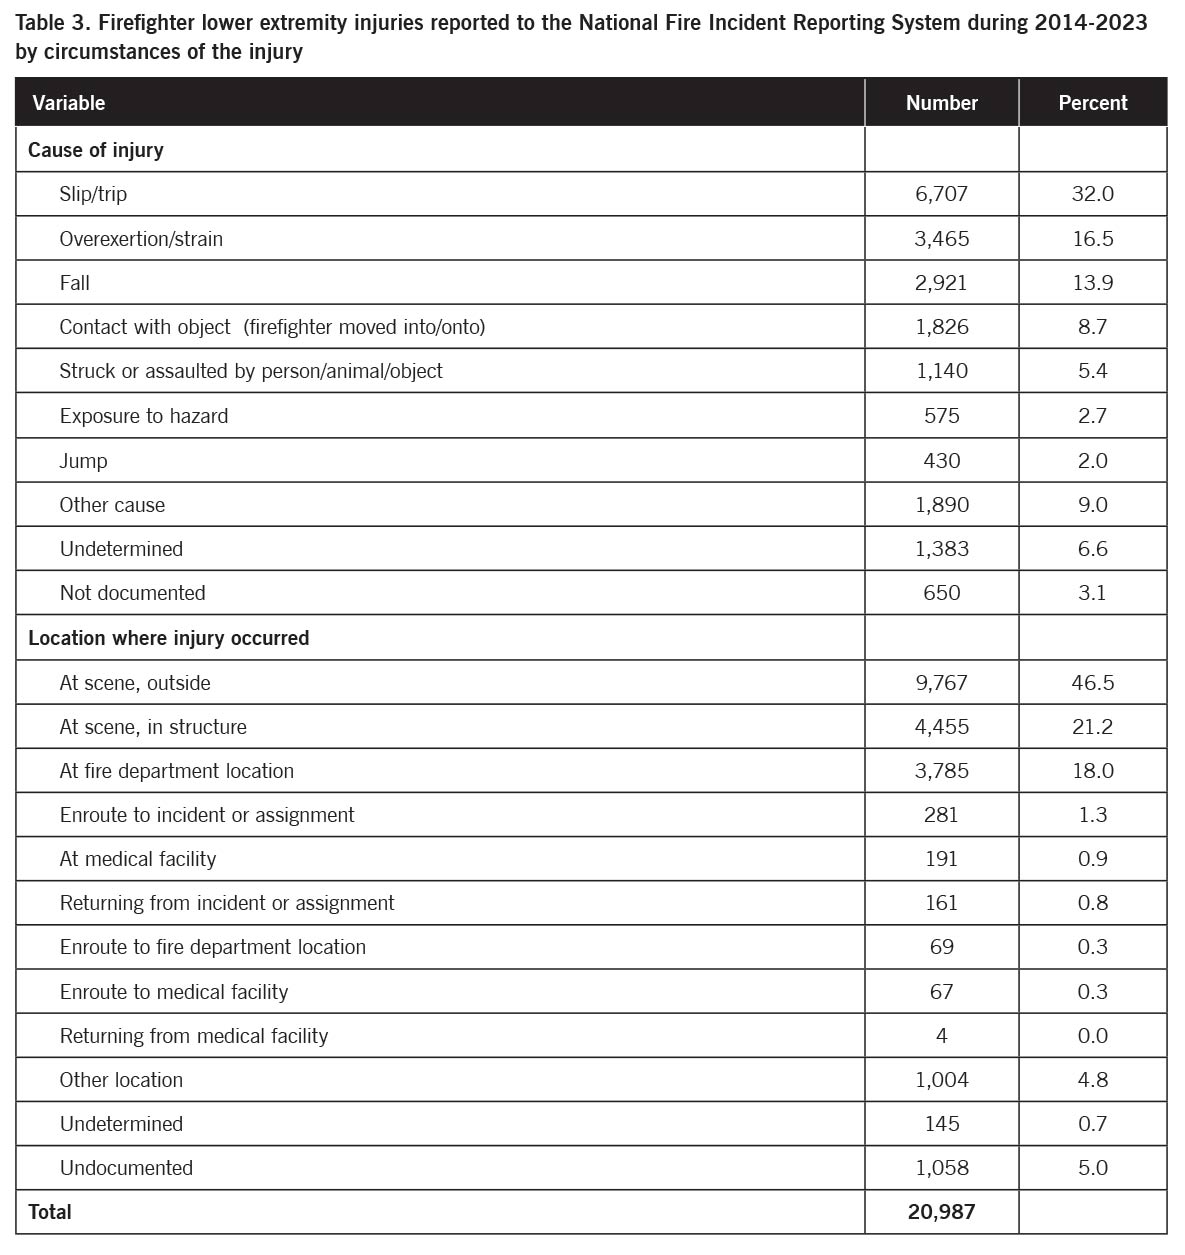
Table 3 presents the distribution of firefighter lower extremity injuries by the circumstances of the injury. The most common causes of injury were slip or trip, overexertion or strain, and fall. The majority (67.8%) of injuries occurred at scene outside or in the structure. The most common activities at the time of the injury, accounting for 37.5% of the total injuries, were 2,125 (10.1%) handling charged hose lines, 1,830 (8.7%) getting off fire department vehicle, 1,530 (7.3%) providing emergency medical service care, 1,456 (6.9%) extinguishing fire or neutralizing incident (other), and 928 (4.4%) training activity or drill.
Discussion
 This study examined firefighter lower extremity injuries reported to a national database of incidents to which fire departments respond during a recent 10-year period. Such information is important because there were an estimated 1 million career and volunteer firefighters in 2020.1 Thousands of firefighter injuries occur annually. The highest proportion of these injuries (21%) involve the lower extremity.2
This study found that the part of the lower extremity that was the primary area of injury was the knee, followed in descending order by the ankle, lower leg, foot and toes, and upper leg. The most frequently reported symptoms were strain or sprain, pain only, swelling, and contusion or bruise (minor trauma), accounting for 81% of the total symptoms. Such symptoms might not be considered serious and not expected to require extensive medical attention. This is consistent with the observation that the severity of 65% of the injuries were classified as report only, first aid only, and treated by physician (not a lost-time injury), and 35% of the injuries were classified as lost-time injuries or death. Furthermore, 55% of the injured firefighters were not transported or were taken to a doctor’s office, station or quarters, or residence, and only 27% of the injured firefighters were taken to a hospital.
Of the firefighters with lower extremity injuries, 60% were age 30–49 years, and 94% were male. This is consistent with the NFPA Survey of Fire Departments for US Fire Experience During 2020, which found that 50% of firefighters were age 30–49 years, and 91% were male.1 Most of the firefighters with lower extremity injuries were career firefighters. This contrasts with the 2020 survey, which reported that 35% of firefighters were career firefighters.1 This might suggest that career firefighters are at greater risk of lower extremity injuries. If this is true, it may relate to differences between career and volunteer firefighters in the activities they perform. It also may reflect differences between career and volunteer fire departments with respect to participation in NFIRS.
The annual mean number of firefighter lower extremity injuries was 2,265 during 2014–2019 and 1,850 during 2020–2023, a decline of 18% in the latter part of the study period. Between 2013 and 2022, there was a 4% decrease in residential building fires.8 With fewer residential building fires, firefighters might be less likely to be injured. In addition, the COVID-19 pandemic began in late 2019 to early 2020 9;the societal disruptions associated with the pandemic may have affected the pattern of firefighter activities and their risk of lower extremity injury.
Massachusetts reported the highest number of firefighter lower extremity injuries, followed by Ohio, Florida, Illinois, New York, and Texas. This may reflect geographic differences in the number of incidents to which fire departments might respond, in the number of firefighters, or risk of lower extremity injury to firefighters. However, it may also be due to geographic differences in fire department participation in NFIRS.
This study is subject to limitations. Fire department participation in NFIRS is voluntary, so the database does not include all incidents to which all US fire departments respond.5 This particularly needs to be considered in the analysis of certain variables such as geographic region and whether the injured firefighter was a career or volunteer firefighter. In addition, each record only documents a single primary symptom and the associated body part. An injury may involve multiple symptoms and/or multiple body parts. Thus, the number of lower extremity injuries included in the study should be considered a minimum number of such injuries.
In conclusion, this study found that approximately 2,000 firefighter lower extremity injuries were reported to NFIRS each year. This study suggests that most firefighter lower extremity injuries are not likely to be severe and may be managed outside of a hospital. The information in this study may be useful for creating strategies to prevent firefighter lower extremity injuries.
Mathias B. Forrester, BS, is an independent researcher in Austin, Texas. Now retired, he has performed public health research and consultation for various university and government programs for 40 years.
- Fahy R, Evarts B, Stein GP. U.S. Fire Department Profile – 2020. National Fire Protection Association, Quincy, Massachusetts, US, 2022. Available at https://npr.brightspotcdn.com/03/bf/7bb8a5f04651b98de071b3464196/osfdprofile.pdf. Accessed February 22, 2025.
- U.S. Fire Administration. Fire-Related Firefighter Injuries Reported to the National Fire Incident Reporting System (2018-2020). November 2022. Available at https://www.usfa.fema.gov/statistics/reports/firefighters-departments/firefighter-injuries-v22i4.html. Accessed February 22, 2025.
- U.S. Fire Administration. National Fire Incident Reporting System. October 9, 2024. Available at https://www.usfa.fema.gov/nfirs/. Accessed February 22, 2025.
- U.S. Fire Administration. National Fire Incident Reporting System Complete Reference Guide. January 2015. Available at https://www.usfa.fema.gov/nfirs/documentation/. Accessed February 22, 2025.
- The National Fire Incident Reporting System and the Public Data Release File. NFIRS and PDR Overview 2023. In the 2023 All Incidents data download.
- U.S. Fire Administration. Access NFIRS Data. October 17, 2024. Available at https://www.usfa.fema.gov/nfirs/access-data/. Accessed February 22, 2025.
- Federal Emergency Management Agency. Annual NFIRS Public Data. Available at https://www.fema.gov/about/openfema/data-sets/fema-usfa-nfirs-annual-data. Accessed February 22, 2025.
- U.S. Fire Administration. Residential fire estimate summaries (2013-2022) U.S. Fire Administration, May 15, 2024. Available at https://www.usfa.fema.gov/statistics/residential-fires/#:~:text=Overall%20trends%20for%20residential%20building,An%208%25%20decrease%20in%20injuries. Accessed February 22, 2025.
- Muccari R, Chow D, Murphy J. Coronavirus timeline: Tracking the critical moments of Covid-19. NBC News December 29, 2020. Available at https://www.nbcnews.com/health/health-news/coronavirus-timeline-tracking-critical-moments-covid-19-n1154341. Accessed February 22, 2025.