Physical exercise induces spatially heterogeneous adaptation in bone. However, it remains unclear where the changes in bone mineral density (BMD) and geometry have the greatest impact on femoral neck strength.
 By Dermot O’Rourke, Belinda R. Beck, Amy T. Harding, Steven L. Watson, Peter Pivonka, Saulo Martelli
Osteoporotic hip fractures are a considerable cause of morbidity and mortality and occur in specific local regions where strain exceeds tissue strength. Focal bone loss in osteoporosis has been found to play a key role in determining fracture risk and fracture location. Meanwhile, the mechanical loading associated with exercise can cause higher than normal strain in certain locations, which elicits a spatially heterogeneous adaptative response in the bone to improve resistance to future strain. However, the relative contributions of spatially heterogeneous adaptations in bone mineral density (BMD) and geometry on femoral neck strength are not well understood. Additionally, there are contrasting opinions on where spatially heterogeneous adaptation in the proximal femur has the greatest impact on its strength.
Toward that end, the aim of this study was to determine the principal BMD-and-geometry changes induced by exercise that have the greatest effect on femoral neck strength. A secondary aim was to compare BMD-and-geometry changes caused by an established exercise protocol to controls based on those BMD-and-geometry changes most associated with changes in strength.
Methods
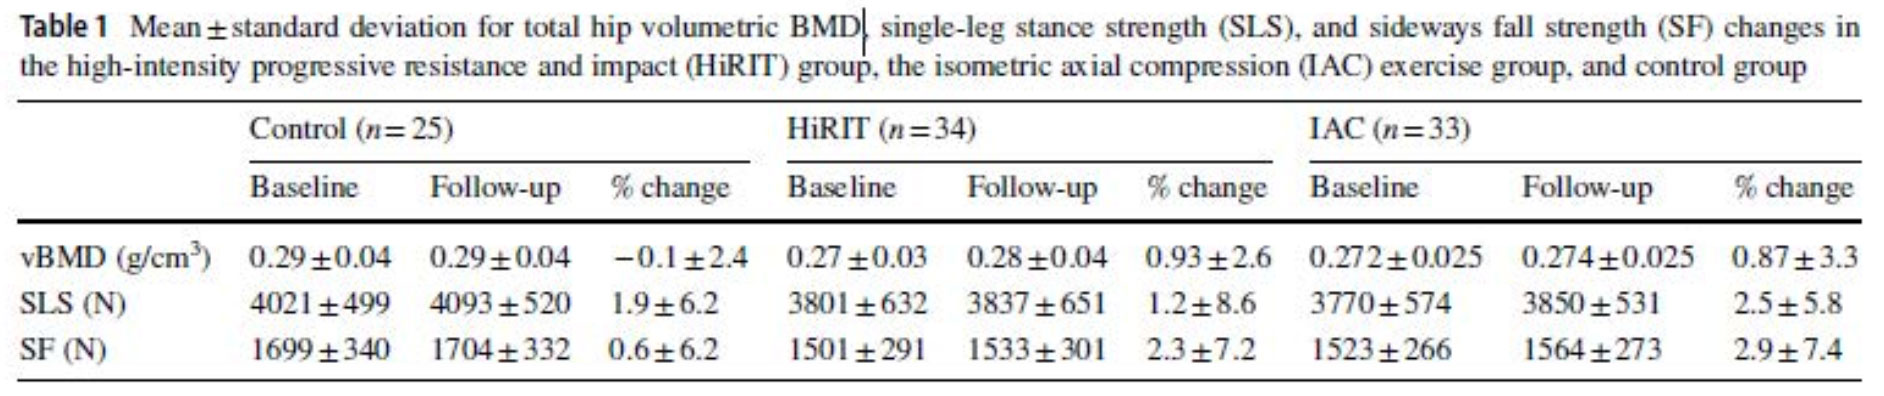
Pre- and post-exercise intervention DXA scans (an imaging test that measures bone density) were obtained of the non-dominant proximal femur from male participants with osteoporosis and osteopenia (67±7 years) in Australia’s LIFTMOR-M (Lifting Intervention for Training Muscle and Osteoporosis Rehabilitation for Men) 8-month semi-randomized controlled targeted exercise intervention trial, which was designed to reduce the risk of osteoporotic fracture in older men with low bone mass. The participants were from 3 groups: a high-intensity progressive resistance and impact training group (HiRIT, n=34), a machine-based isometric axial compression group (IAC, n=33), and a control group of sex- and age-matched participants from the same community (67±6 years) (n=25). The HiRIT program consisted of multi-joint, compound movement, high-intensity progressive resistance training, and high-impact jumping exercises. The IAC program incorporated self-initiated near-maximal 5-second isometric contractions performed for the chest press, leg press, core pull, and vertical lift exercises using the bioDensity™ system. The trial protocol has been published describing the exercise interventions and control group activities.
Meshes with element-by-element correspondence were generated by morphing a template mesh to each bone to calculate changes in BMD and geometry. Finite element (FE) models predicted femoral neck strength changes under single-leg stance and sideways fall load (Fig. 1). Partial least squares regression (PLSR) models were developed with (1) combined geometry and BMD, (2) geometry only, and (3) BMD only to determine the principal modes that explained the greatest variation in neck strength changes.
Results
The BMD-only PLSR model explained over 90% of the strength variation in single-leg stance and sideways fall across all participants with 3 PLS components (R2>0.92, root mean square error (RMSE)<0.06 N). The geometry-only models explained over 90% of the strength variation in single-leg stance and sideways fall with 8 PLS components (R2>0.93, RMSE<0.06 N). The combined BMD-and-geometry models were closer to the BMD-only models, explaining 90% of the bone strength variation in both single-leg stance and sideways fall with 5 PLS components each (R2>0.93, RMSE<0.06 N).
The first 3 modes of variation of the BMD-only models displayed similar patterns of BMD changes for both single-leg stance and sideways fall. The largest BMD changes (±0.1 g/cm3) were found in the cortex distal to the femoral neck for the first mode of variation. The second mode displayed focal changes (±0.06 g/cm3) in the distal cortex, superior and inferior neck cortex, and the medial femoral head. The third mode showed the largest BMD changes (±0.05 g/cm3) in the distal cortex and superior femoral head, while BMD changes in the superior neck were slightly larger for the sideways fall load case as compared to the single-leg stance load case. Similarly, the first 2 modes of variation of the geometry-only models for single-leg stance and sideways fall displayed the largest changes in the proximal femoral shaft and femoral head and the femoral neck. However, the variable importance in projection (VIP) scores indicated that the most important BMD changes for femoral neck strength differed between sideways fall and single-leg stance. During sideways fall, the most important regions were those of the superior femoral head and lateral trochanteric region, while during single-leg stance the most important BMD changes were those of the superior neck and the distal cortex. The VIP scores for geometry changes confirmed the importance of the femoral neck during single-leg stance and the trochanteric and head regions during a sideways fall.
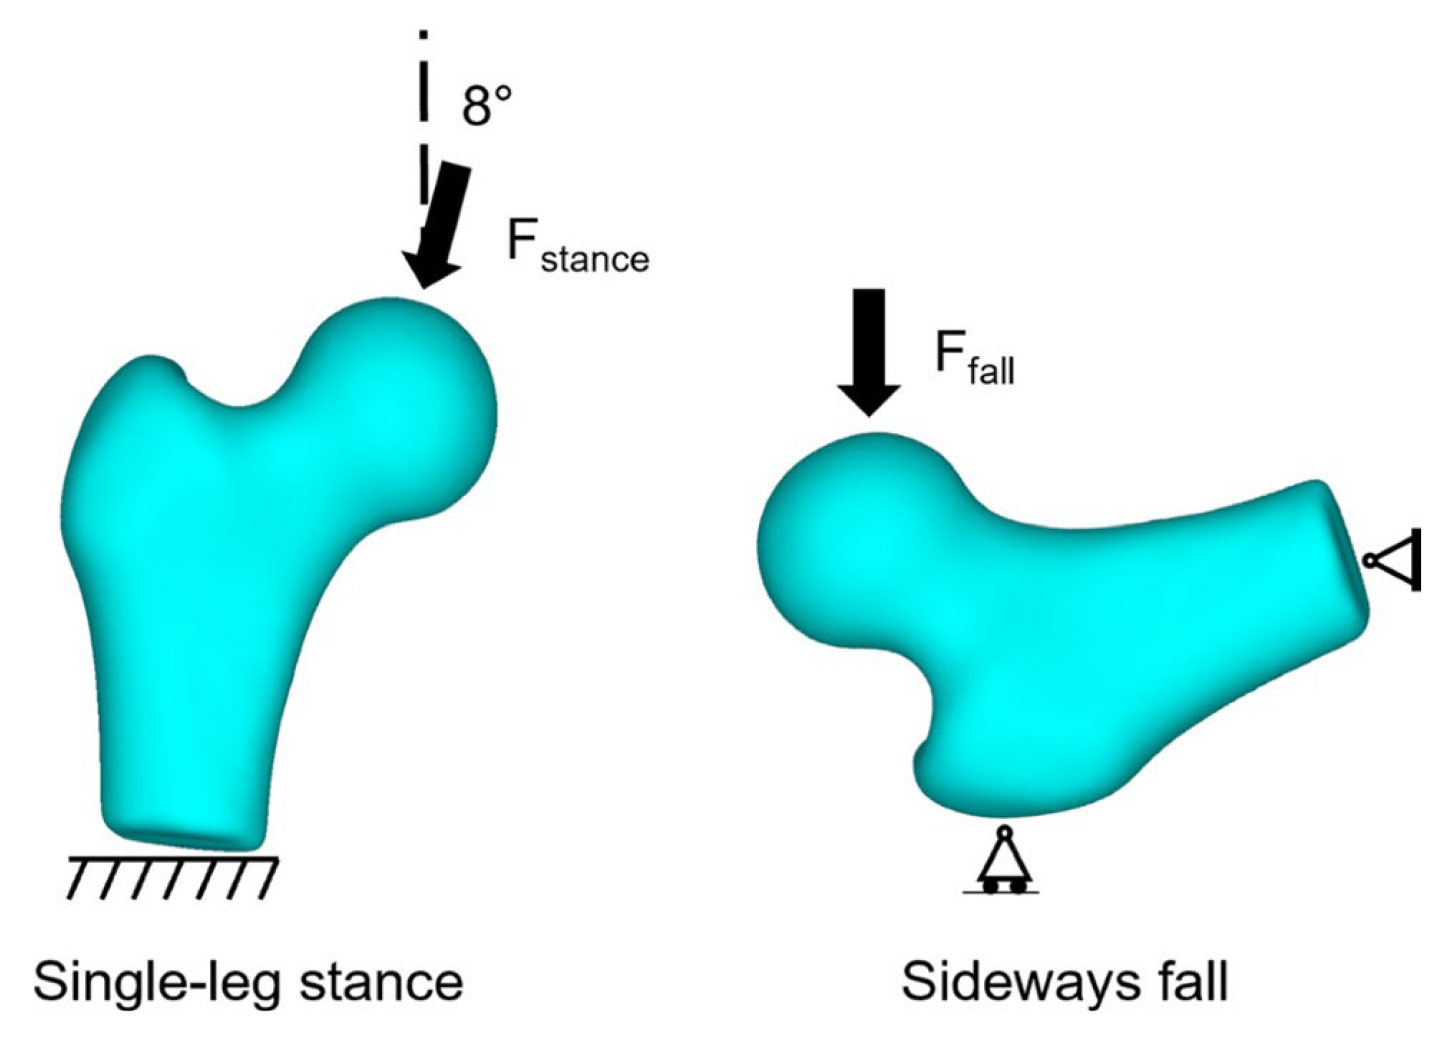
Figure 1. Single-leg stance and sideways fall loading conditions simulated to calculate the change in femoral neck strength.
Comparing vBMD and strength changes, there were no statistically significant differences between groups for vBMD changes (F=1.05, P=0.36) nor in strength changes either for single-leg stance (F=0.26, P=0.77) and sideways fall (F=0.83, P=0.77) as determined by 1-way ANOVA (Table 1). However, differences were observed between the control group and both the HiRIT and IAC groups using the PLS modes in the geometry-only, and the geometry-and-BMD models. Specifically, a Bonferroni post hoc test indicated that both the HiRIT and IAC groups had significantly higher PLS component 2 scores in single-leg stance and PLS component 1 scores in sideways fall. No difference in PLS component scores was found between the HiRIT and IAC groups.
Discussion
The current study determined the principal BMD-and-geometry changes induced by exercise that explained most of the variation in femoral neck strength. Changes to BMD in the superior neck, inferior neck, and greater trochanter primarily explained the variation in neck strength changes seen in the group of middle-aged and older men with osteopenia and osteoporosis in single-leg stance and sideways fall loading. Local changes in femoral neck and head geometry could differentiate the exercise groups from the control group, but not in predicted strength changes. Exercise interventions may target BMD changes in the superior neck, inferior neck, and greater trochanter for improved femoral neck strength in single-leg stance and sideways fall.
This article has been excerpted from “Geometry and Bone Mineral Density Determinants of Femoral Neck Strength Changes Following Exercise,” which appeared in Biomechanics and Modeling in Mechanobiology in October 2022. https://doi.org/10.1007/s10237-022-01642-w. Editing has occurred, including the renumbering of tables, and references have been removed for brevity. Use is per CC BY 4.0.