 By Yifeng Yan, Jianlin Ou, Hanxue Shi, Chenming Sun, Longbin Shen, Zhen Song, Lin Shu, and Zhuoming Chen
Previous studies have confirmed that there is a difference in plantar pressure between falls and non-falls in elderly people, but the relationship between fall risk and foot pressure has not been studied.
Studies show approximately 28% of elderly people age 65 and above fall every year. The increased risk of falls is associated with an increment of gait variability. These gait changes are caused by diminished balance control, degeneration of the musculoskeletal system, and diminished sensorimotor function. As gait changes, plantar pressure will change correspondingly. Therefore, the plantar pressure in walking is often used to study normal and abnormal gait characteristics.
Previous studies have confirmed that there is a difference in plantar pressure between falls and non-falls in elderly people, but the relationship between fall risk and foot pressure has not been studied. The 2 aims of this study were to investigate whether there are differences in dynamic plantar pressure among elderly people at high and low risk of falls. And if there are differences, the study authors tried to search for the plantar pressure characteristic parameters.
Methods
For this cross-sectional study, 24 high-fall-risk elderly individuals (HR) and 24 low-fall-risk elderly individuals (LR) were selected using the Berg Balance Scale 40 score. Inclusion criteria: (a) age 65 or older; (b) capable of independent walking for 3 minutes without assistance; (c) clear consciousness, able to cooperate with the assessment, Mini-mental State Examination score > 24; and (d) with available informed consent. The baseline data, including sex, age, height, body weight and body mass index of the 2 groups were compared, and the differences were not statistically significant (P > 0.05).
Results & Discussion
This paper prospectively investigates the relationship between fall risk and plantar pressure. The results showed that the differences in between-group comparisons were mainly focused on midfoot and heel, so the study authors assumed that HR may have been more cautious when landing. As for the comparison within the group, the differences between the left and right foot in LR occurred mainly when the heel contacted the ground, while in HR they occurred mainly when the foot stroked the ground. In the within-group comparisons between the 2 groups, the differences in foot pressure were in different areas.
 During the formal experiment, participants needed to walk for more than 2 minutes along a 20-meter corridor at their normal gait and usual walking speed. Based on previous studies combined with plantar mechanics, the plantar area was divided into 8 regions for analysis: 1st toe (T1), 1st metatarsal head (M1), 2nd-3rd metatarsal head (M2-3), 4th-5th metatarsal head (M4-5), medial midfoot (MMF), lateral midfoot (LMF), medial heel (MH), and lateral heel (LH) (See Figure A).
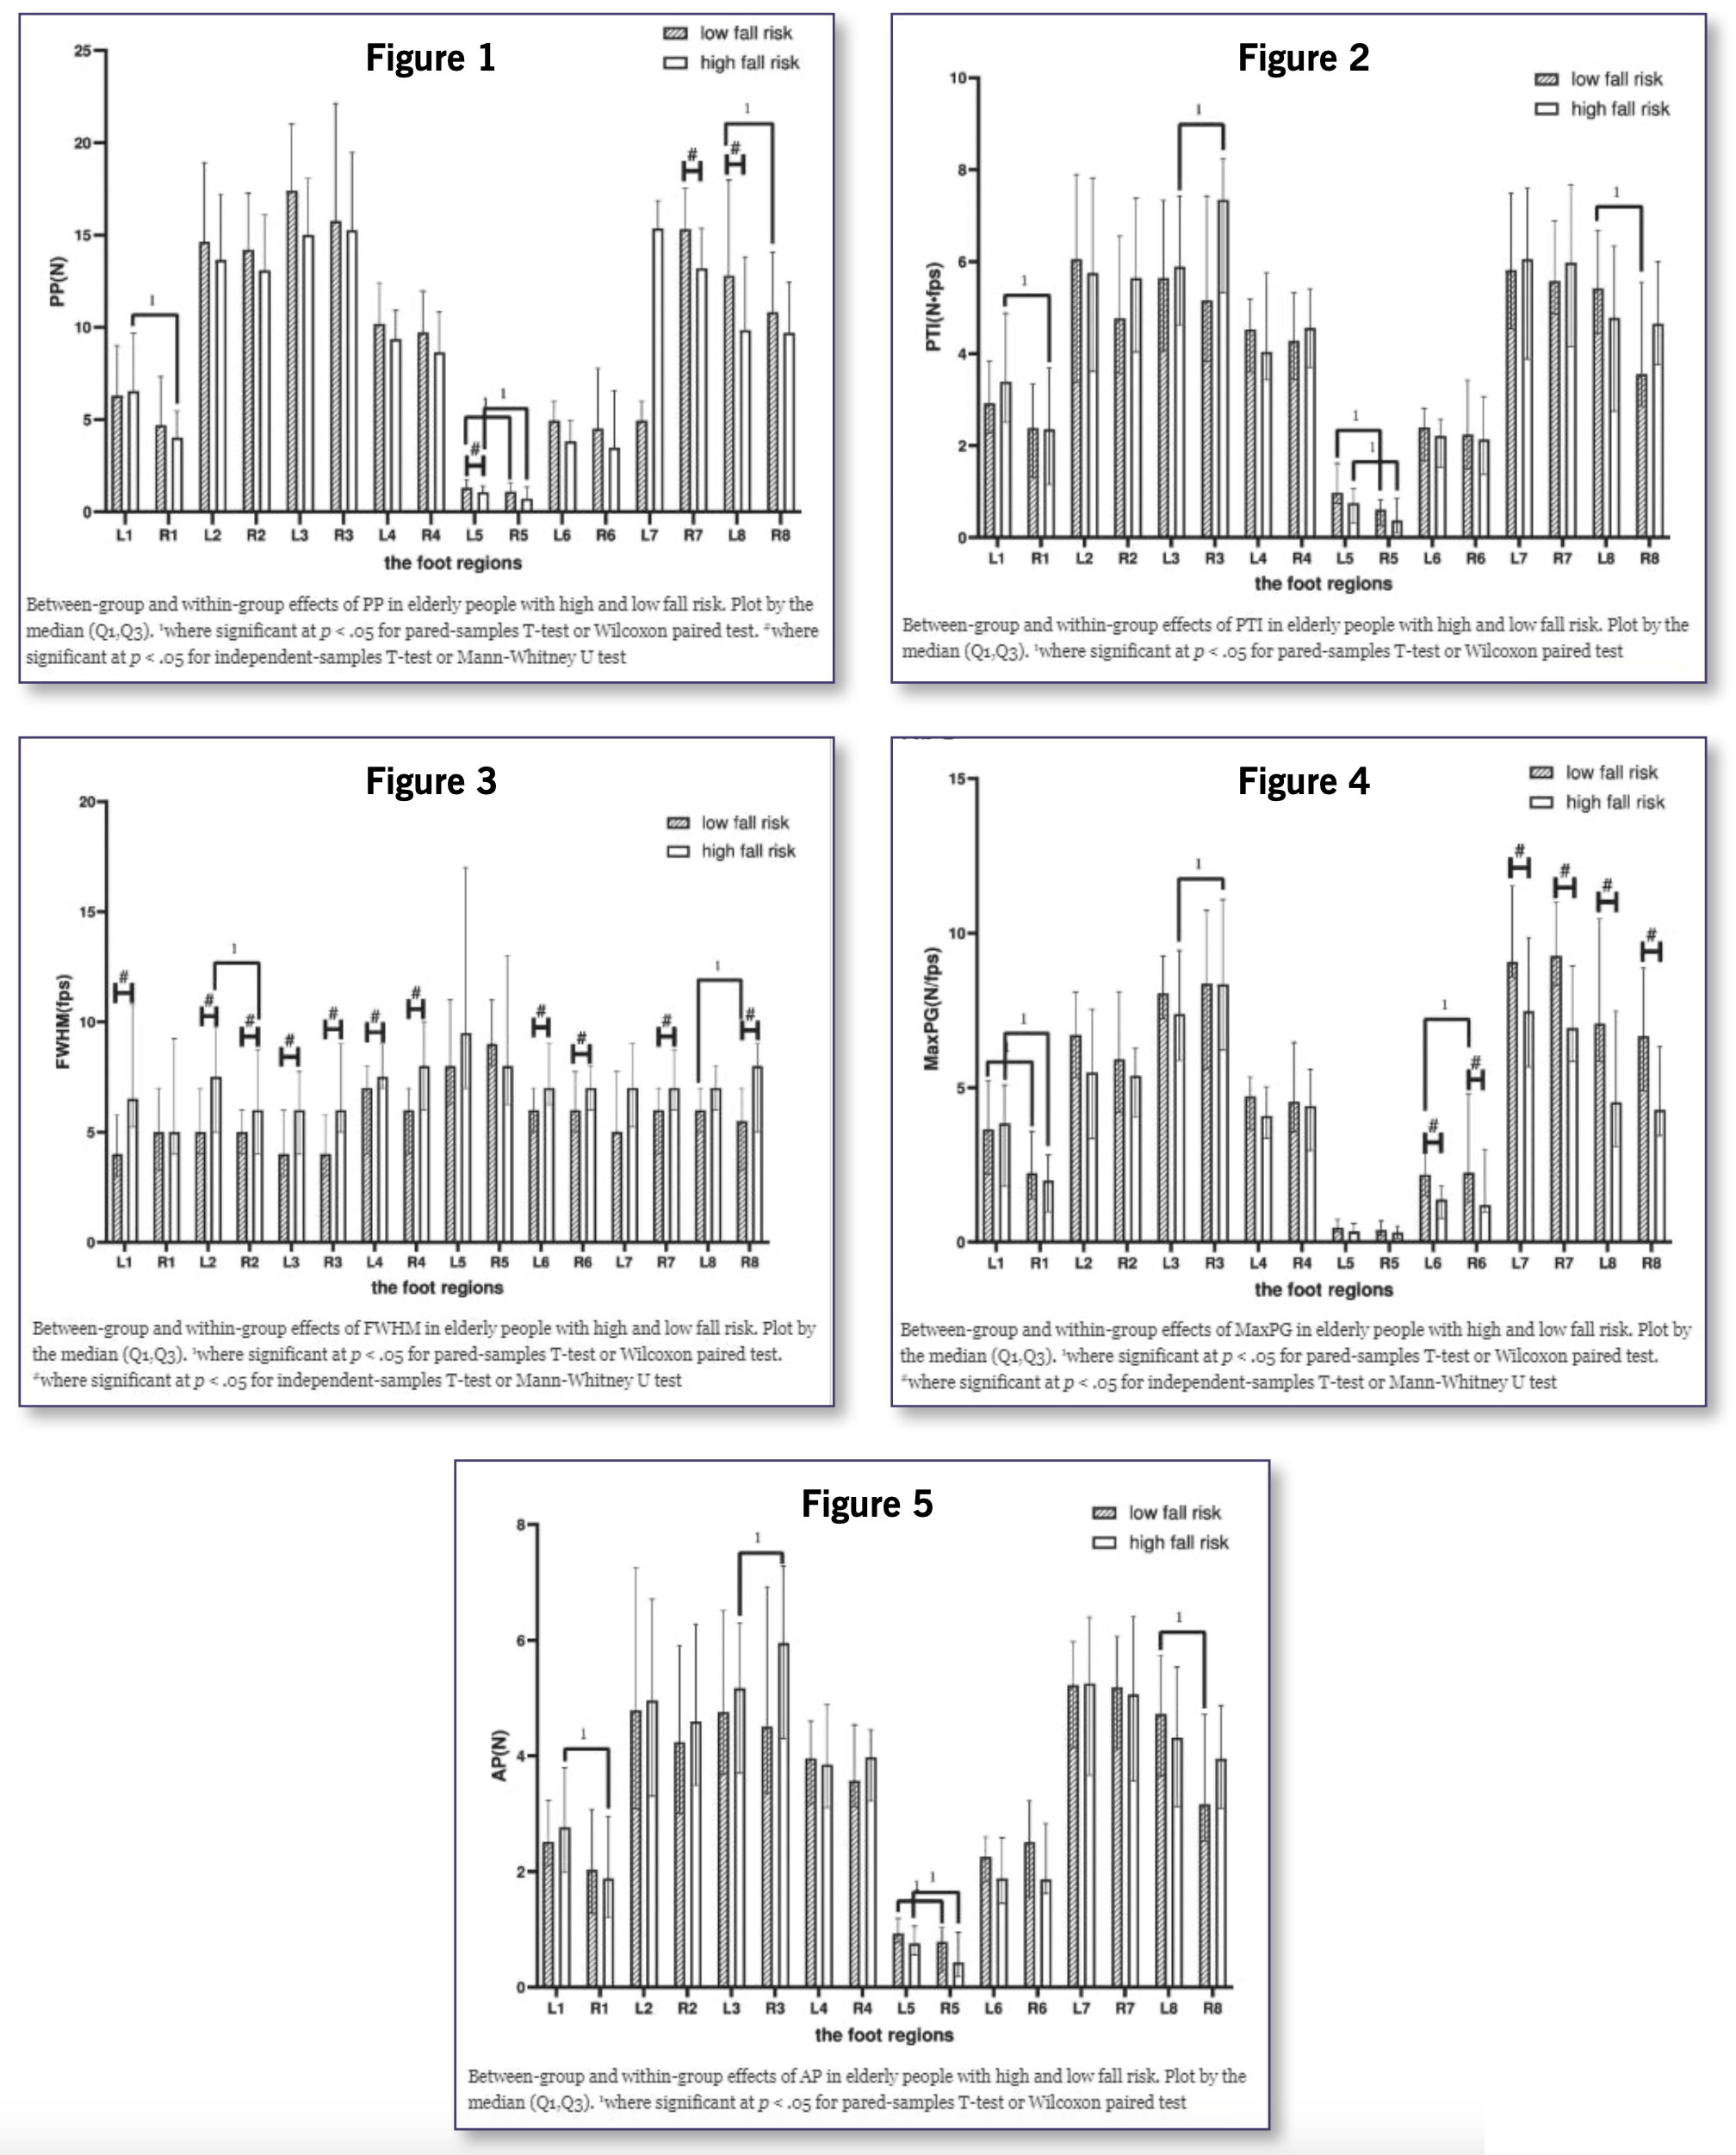
After weight normalization and identification of valid gait cycles, for each foot region, the study authors calculated the following parameters: peak pressure (PP), pressure-time integral (PTI), pressure gradient (maximum pressure gradient (MaxPG), minimum pressure gradient (MinPG), full width at half maximum (FWHM)), and average pressure (AP).
Peak pressure
Between-group comparison: Compared with the LR, the PP was reduced in the left-MMF, left-LH and right-MH in the HR (P < 0.05). Within-group comparison: In the LR, differences comparing the left foot with the right foot were shown in the LH and MMF (P < 0.05). In the HR, it was shown in the MMF and the T1 (P < 0.05), as shown in Figure 1.
Pressure–time integral
Within-group comparison: In the LR, differences comparing the left foot with the right foot were shown in the LH and MMF (P < 0.05). In the HR, it was shown in the T1, the M2-3 and the MMF (P < 0.05) (Figure 2). Comparison between groups: There was no statistical difference.
Full width at half maximum
Comparison between groups: Compared with the LR, the FWHM increased in elderly people in the HR in the following regions (P< 0.05): the left-T1, the left-M1, the left-M2-3, the left-M4-5, the left-LMF, the right-M1, the right-M2-3, the right-M4-5, the right-LMF, the right-MH, the right-LH. Within-group comparison: In the LR, the difference comparing the left foot with the right foot was shown on the LH (P < 0.05). In the HR, it was shown at the M1 (P < 0.05), as shown in Figure 3.
Maximum pressure gradient
Between-group comparison: Compared with the LR, the MaxPG in elderly people in the HR decreased in the following regions (P < 0.05): left-LMF, left-MH, left-LH, right-LMF, right-MH, and right-LH. Within-group comparison: In the LR, differences comparing the left foot with the right foot were shown in the T1 and LMF (P< 0.05). In the HR, it was shown in the T1 and the M2-3 (P < 0.05), as shown in Figure 4.
Minimum pressure gradient
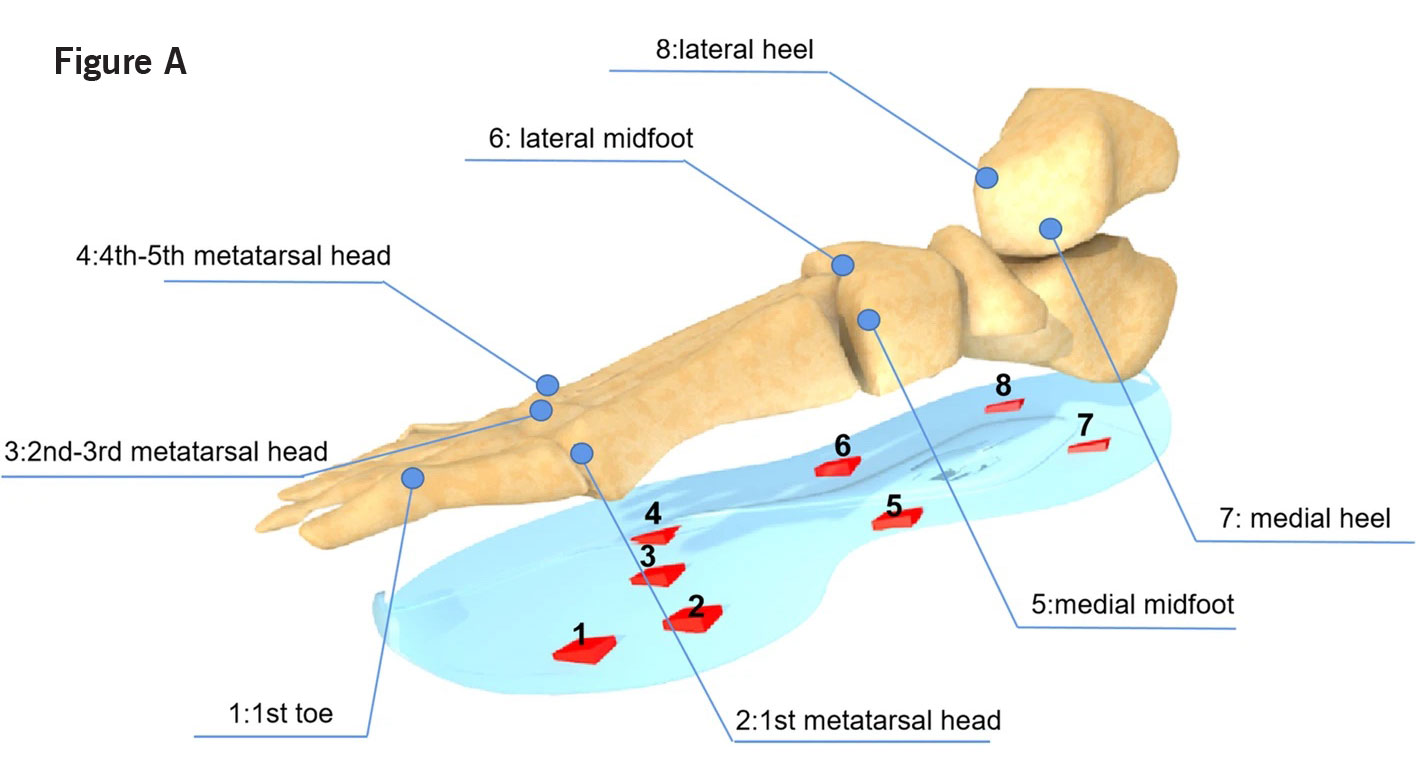
Position of 8 pressure sensors. The right foot is shown as an example.
Within-group comparison: only in the LR, the left and right feet of the M4-5 showed differences (P < 0.05). Comparison between groups: There was no statistical difference.
Average pressure

Within-group comparison: in the LR, differences comparing the left foot with the right foot were shown in the LH and MMF (P < 0.05). As shown in Figure 5, in the HR, it was shown in the T1, M2-3 and MMF (P < 0.05). Comparison between groups: There was no statistical difference.
Conclusion
These preliminary results suggest that there were indeed differences in plantar pressure between high- and low-fall risk in older adults and that plantar pressure may be used to determine fall risk, especially pressure gradient. The differences comparing the high-fall risk with low-fall risk groups were mostly reflected in the midfoot and heel. The HR may have been more cautious when landing. In the intra-group comparison, the difference between the right and left foot of the LR was mainly reflected during heel striking, while it was mainly reflected during pedaling in the HR. The sensitivity of PP, PTI, and AP was lower, and the newly introduced pressure gradient could better reflect the difference in foot pressure between the 2 groups. The pressure gradient can be used as a new foot pressure parameter in scientific research.
This article has been excerpted from “Plantar Pressure and Falling Risk in Older Individuals: A Cross-sectional Study.” Journal of Foot and Ankle Research. 2023;16:14. https://doi.org/10.1186/s13047-023-00612-4. Editing has occurred, including the renumbering of tables, and references have been removed for brevity. Use is per CC BY.