By Jay Segel, DPM; Sally Crawford, MS; Ronald Sherman, DPM, MBA
Identifying this increasing fall risk can help older patients stay safe.
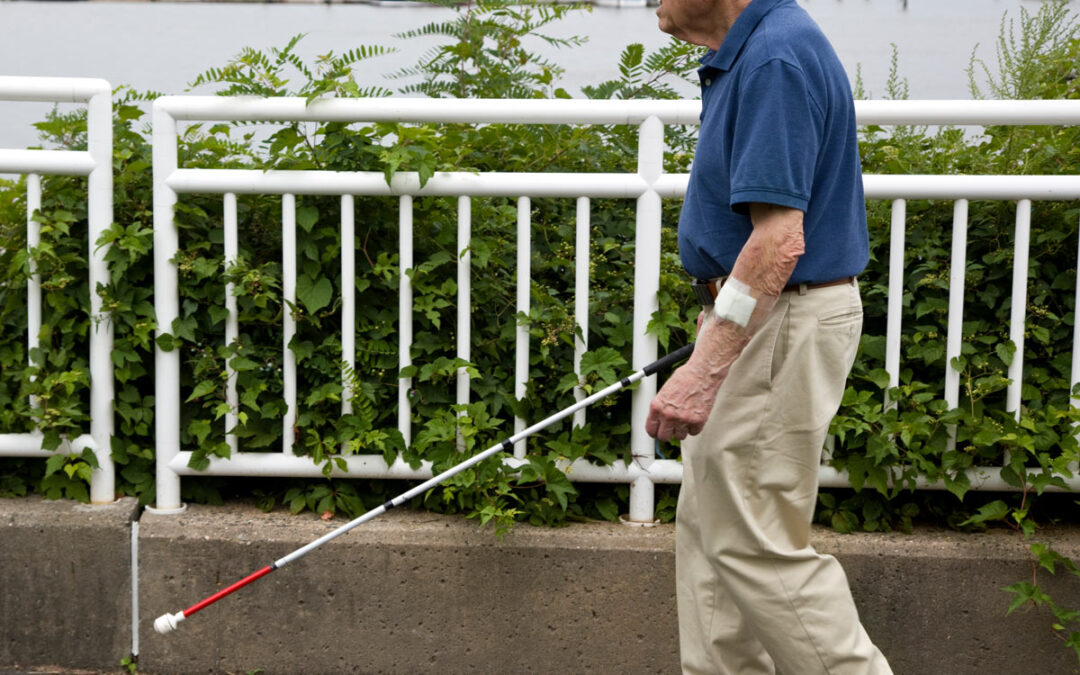
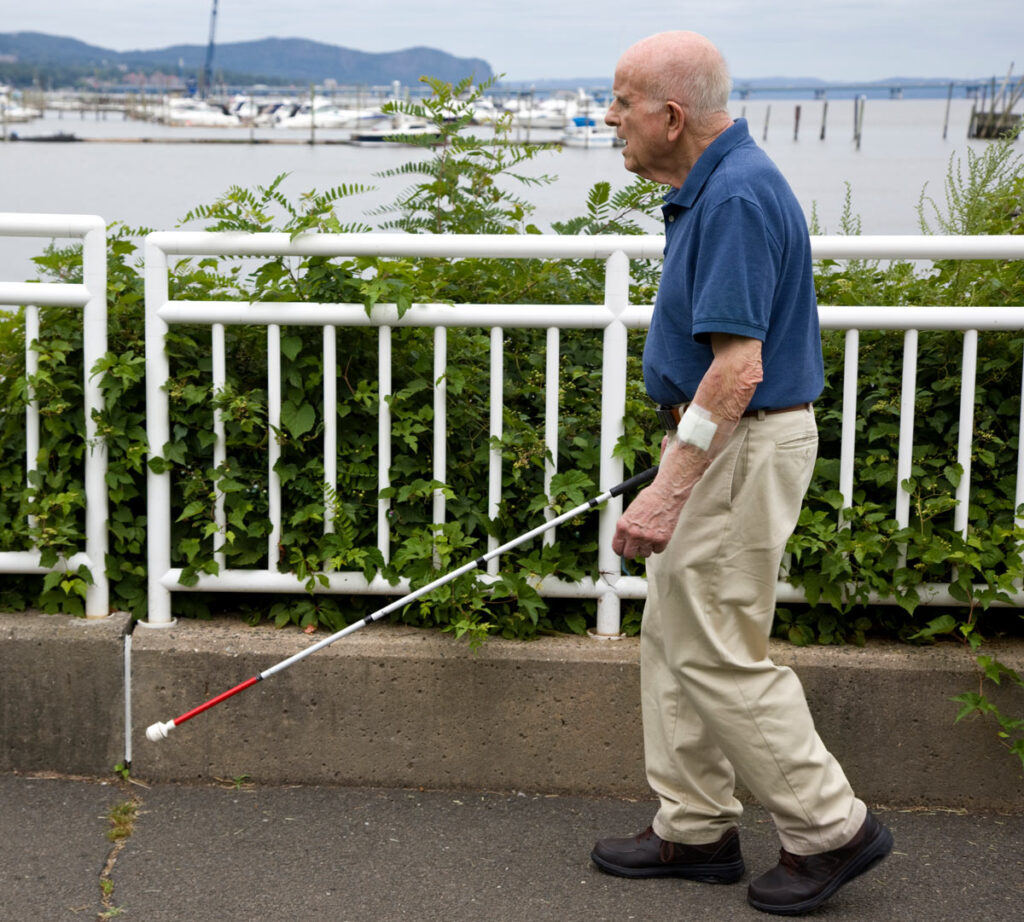 Imagine for a moment, you were cast into a world of uncertainty by the loss of sight. Your relationship with all you know is forever changed. We have “tells” to these challenges and learn ways of adapting to our new circumstances. We do things slower, with less confidence, and rely on our other senses. We listen for auditory cues, but perhaps the sense we lean on most is that of touch. We reach out with our hands, feeling our surroundings and cautiously find our footing in this altered state of reality called “blind gait.” As clinicians, if we are skillful in our gait analysis, we can observe this sign before a patient is aware of or willing to share their concerns about balance and stability.
Successful quantification in gait analysis is the first step, though it is typically lacking as outcomes are not always related to a patient’s baseline, or patient’s report of their motion or pain/soreness as these are solely subjective. To understand such outcomes more objectively, gait and balance variables and even movement variability are assessed to uncover the patterns illustrating characteristics of “blind gait.” We can measure these patterns for any individual and being proactive is paramount especially when dealing with blind motions.
Potentially dangerous, “blind gait” characteristics from such tests are often seen in patients with sensory and motor neuropathy, patients with a history of low back pain, those who present status post-joint replacement, and of course, in our aged population. The traits or outcomes of this “blind gait“ are highlighted by a distal shift in the initial point of impact, later forefoot peak pressure times, increased segmental duration times, positional changes, such as increased step width and foot abduction, as well as the classic a-propulsive gait with an unwillingness to lift the heel off the ground that can be tracked by a decrease in swing phase (Figure 1, Figure 2). The ironic thing about this gait pattern is that it actually makes the patient less stable and more prone to falls, in other words, this gait pattern is characterized by variables corresponding to increased fall risk. Skillful gait analysis will identify these risk factors.
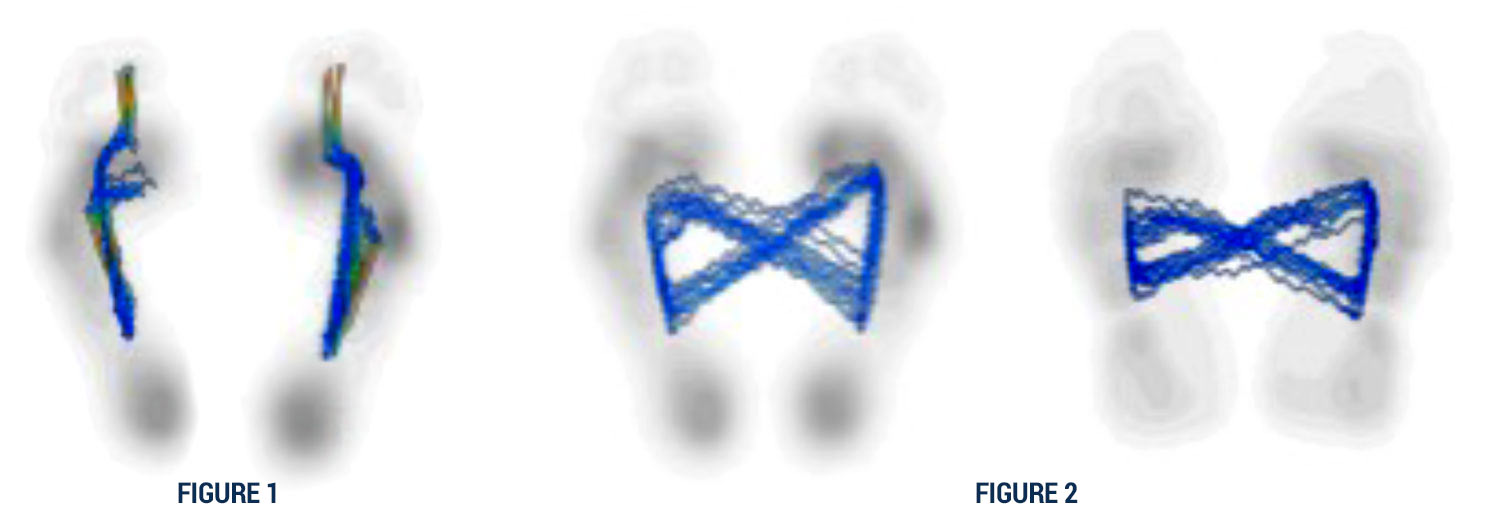
Figure1: Distal shift in the initial point of impact of the center of pressure path. Figure 2: Positional changes, such as increased step width and foot abduction, as well as heightened variability correspond to increased fall risk.
Consider the spinning of a top: When the top is balanced and moving rapidly through its revolutions, it stays upright and very straight. However, when the top slows down, it becomes wobbly and more prone to falling. When measuring the spinning top’s path through the center of pressure (COP), the variability of COP worsens, and the area increases with decreasing speeds. For patients, it is not only important for you to notice this worsening COP area, but to offer counsel, through the use of orthotic devices and gait training for fall prevention, and improvements of the patient’s biomechanics. Identifying the COP mechanics following this algorithm is also meaningful to the patient as a means of illustrating the danger.
Another problematic gait analysis outcome that can be measured is “Retrograde COP.” Retrograde identifies the momentum of the foot during the first 5% of the gait cycle which is moving distal to proximal while the body’s momentum is moving proximal to distal, thus having the potential to create sheer stress at the ankle and subtalar joints in addition to creating wear and tear, heat and deformation at the principal joints of the kinetic chain.
One of the key elements in reading gait mechanics involves understanding planes of motion and loading order. In “blind gait,” the spatial data gathered cannot be applied in the usual manner to assess forefoot loading. Most consider a lateral initial forefoot loading order of 5, 4, 3, 2, 1 to be common, and often representative of the biomechanical deformity known as forefoot varus.
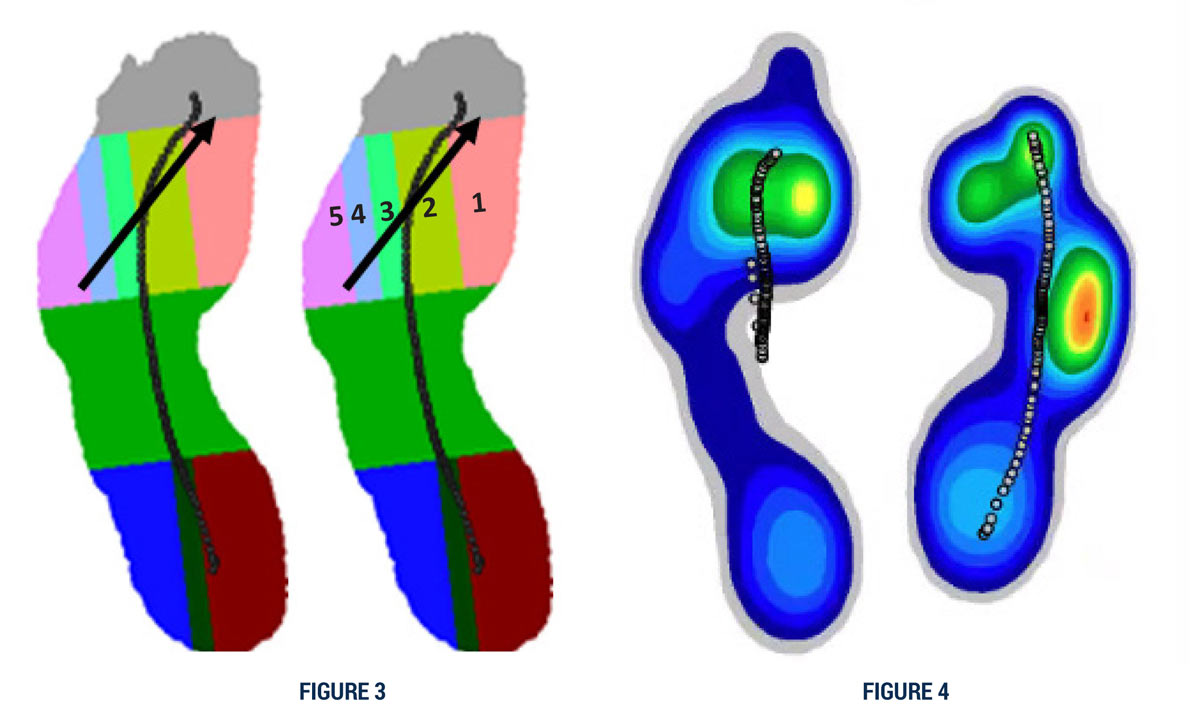
Figure 3: 10 zone system identifying metatarsal head positions and corresponding path and timing of center of pressure. Figure 4: The converse loading pattern is indicative of forefoot valgus and is seen more commonly in the Pes Cavus foot type.
There are other clinical and computer-aided gait analysis (CAGA) factors to be considered as well, chiefly, the starting times that these landmarks make landfall. Given that the initial point of impact does not occur at the heel region, the phasic activity and data deviate from all norms and, as such, must be considered regionally, ideally with a high-definition, slow-motion camera synched to our CAGA treadmill.
The converse loading pattern is indicative of forefoot valgus and is seen more commonly in the pes cavus foot type.
Capturing these quantified patterns early is possible with CAGA. Understanding only a piece of the puzzle regarding changes in gait with age may create a gap in understanding how motion impacts a patient’s safety. To narrow this gap and provide more insight to potentially “blind” biomechanical strategies, learnings from CAGA become important. With such CAGA tools, an understanding of all-encompassing gait metrics and their additional impact in understanding objectively optimized clinical outcomes can be achieved.
Jay Segel, DPM, is a Podiatrist, Biomechanist, Orthotic and Gait Analysis Specialist, in Martha’s Vineyard, MA.
Sally Crawford, MS, is a Biomedical Engineer, IT director, and data manager.
Ronald Sherman, DPM, MBA, is Assistant Professor in the Department of Surgery and Program Director of the Limb Preservation and Wound Care Fellowship at The Johns Hopkins Hospital in Baltimore, MD. He also serves as the Principal Investigator for the DURS CAGA Study.