 By Mathias B. Forrester, BS
Thousands of people have United States (US) rail transportation industry jobs, and millions travel by US rail each year. Injuries may occur to employees, passengers, and others who may interact with the rail transportation system. The objective of this study was to characterize lower extremity injuries involving the rail transportation system.
Methods: An analysis was performed of lower extremity injuries reported to the US Federal Railroad Administration during 2000-2021.
Results: A total of 46,765 lower extremity injuries were identified. The annual number of lower extremity injuries decreased from 2,881 in 2000 to 1,307 in 2021. The patient age distribution was: 2.3% 0-19 years, 12.7% 20-29 years, 20.4% 30-39 years, 23.1% 40-49 years, 23.7% 50-59 years, and 12.0% 60 years or older. In 47.2% of the reported cases, the person was walking, getting off, or stepping down just before the injury, and in 46.8%, the person slipped, fell, or stumbled. Half (50.0%) of the lower extremity injuries occurred beside the track, in a rail car, on stairs, alongside of on-track equipment, or at a work station. The most commonly reported injuries were 42.3% sprain or strain, 23.2% bruise or contusion, 14.6% fracture, and 8.8% laceration or abrasion.
Conclusions: The number of lower extremity injuries reported to the Federal Railroad Administration declined during 2000-2021. The majority of patients injured were age 30-59 years. The most commonly reported injuries were sprain or strain, bruise or contusion, fracture, and laceration or abrasion. Almost half of the injuries involved the person slipping, falling, or stumbling.
According to the United States (US) Bureau of Labor Statistics Current Employment Statistics (CES), in December 2020 there were 144,500 jobs in the US rail transportation industry.1 In 2017, approximately 4.7 million passengers travelled on Amtrak’s long-distance routes.2
Injuries may occur not only to rail transportation employees and passengers but also to others who may interact with the rail transportation system.3-8 The objective of this study was to characterize lower extremity injuries involving the rail transportation system.
Methods
This study used data downloaded from the US Department of Transportation Federal Railroad Administration (FRA) website at https://safetydata.fra.dot.gov/OfficeofSafety/publicsite/on_the_fly_download.aspx. US railroads are required to report information on accidents and incidents including casualties to persons (i.e., deaths and non-fatal injuries to all types of persons and occupational illnesses involving railroad employees) to the FRA. The FRA collects and analyzes the data on these accidents and incidents.9 Record-specific data are publicly available but are de-identified; therefore, the study is exempt from institutional review board approval.
This study included all reports in the FRA casualty (injury) database during 2000-2021where the Location text field included the code 3 (Leg or foot). The variables examined were year and month, injured person’s age, type of injured person, actions just before injury, event which caused injury, specific location of person at time of injury, state, nature of injury, specific body part, and fatality. The description of the data fields and the definition of the codes used in the fields can be found at https://railroads.dot.gov/forms-guides-publications/guides/618055a-injuryillness-continuation-sheet-effect-612011-54kb and at https://safetydata.fra.dot.gov/publicObjects/accinccodes.pdf. The distribution of cases by the variables was calculated.
Results
A total of 46,765 lower extremity injuries were identified, representing 21.8% of the 214,390 total injuries. Figure 1 (page 55) presents the annual number of lower extremity injuries. The annual number of lower extremity injuries declined from 2,881 in 2000 to 1,307 in 2021 with the largest decline of 32.3% observed between 2019 and 2020. Injuries occurred evenly throughout the year: there were 11,862 (25.4%) lower extremity injuries in January-March, 11,529 (24.7%) in April-June, 12,100 (25.9%) in July-September, and 11,274 (24.1%) in October-December.
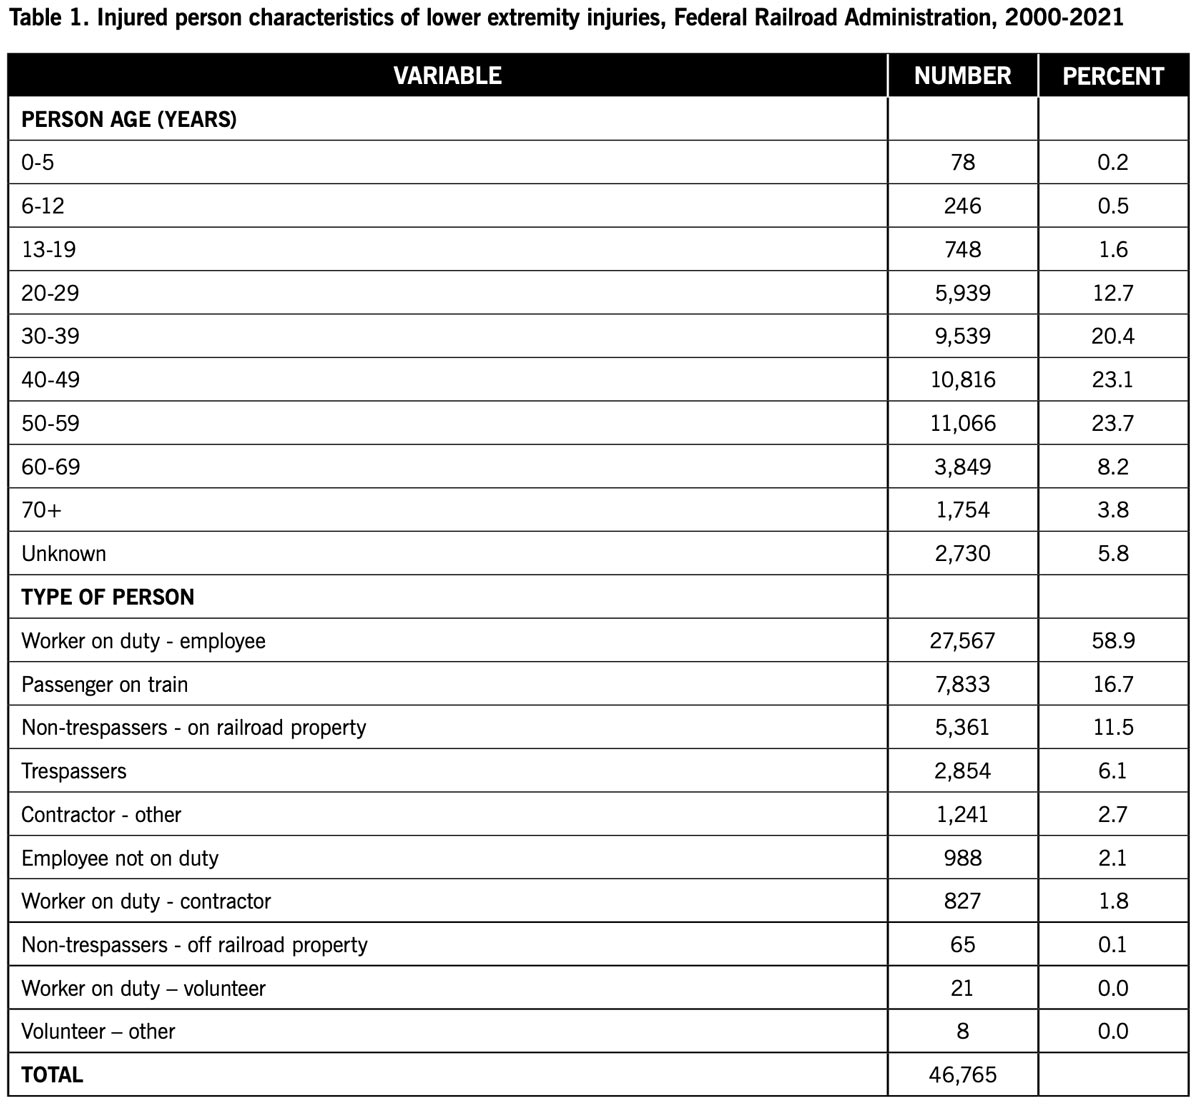
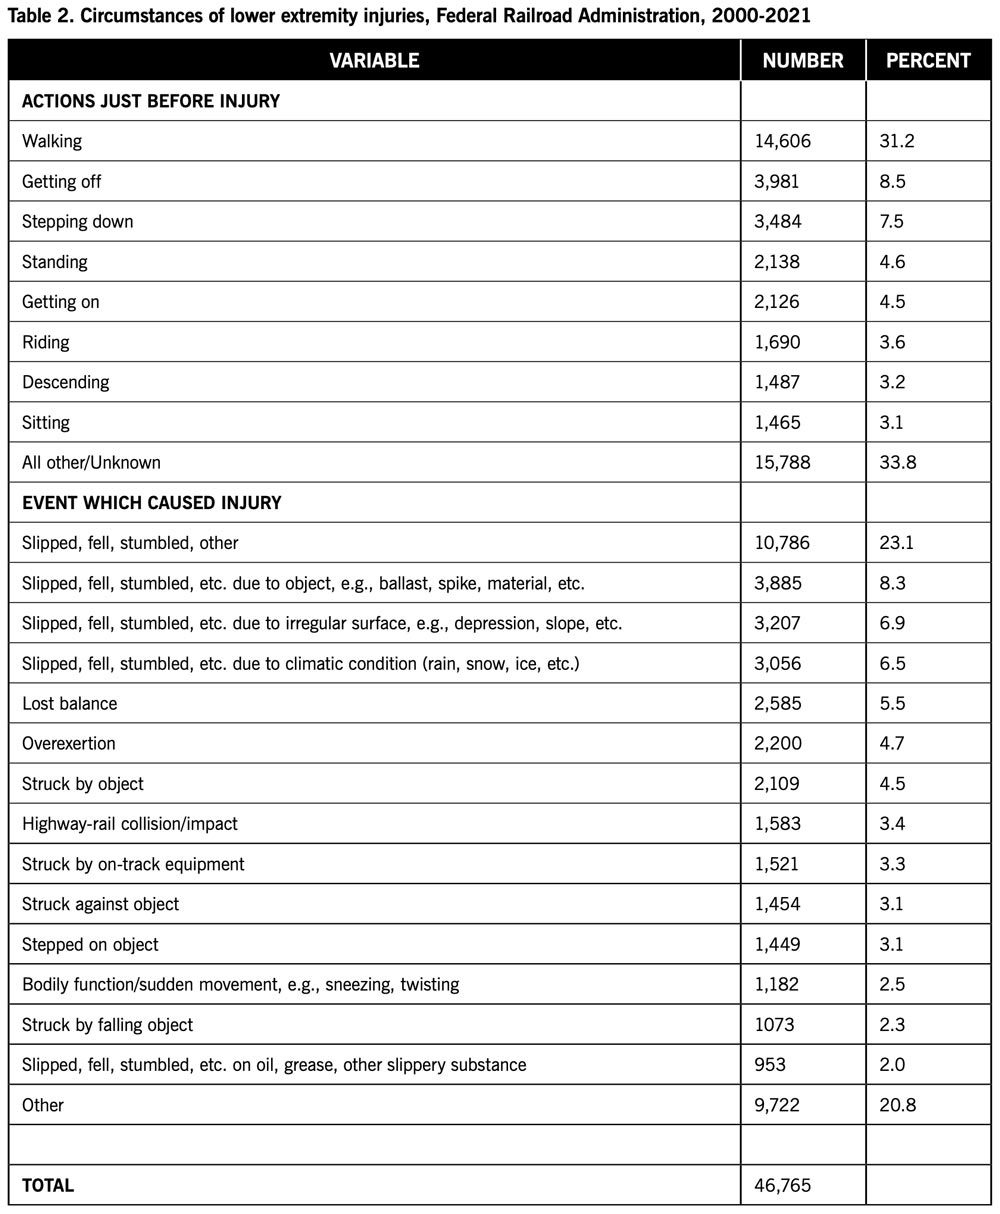
Table 1 shows the distribution of lower extremity injuries by characteristics of the person injured. Only 2.3% of the injuries involved children (0-19 years); 67.2% of the persons were age 30-59 years. For those persons with a reported age, the mean age was 44.5 years (range 1-99 years). At least 62.9% of the persons were rail transportation employees or workers. When the circumstances of the injury were examined (Table 2), the highest proportion of persons were walking just before the injury followed by getting off and stepping down. The most common events involved the person slipping, falling, or stumbling. The highest proportion of lower extremity injuries occurred beside the track followed by in a rail car, on stairs, alongside of on-track equipment, and at a work station (Table 3).
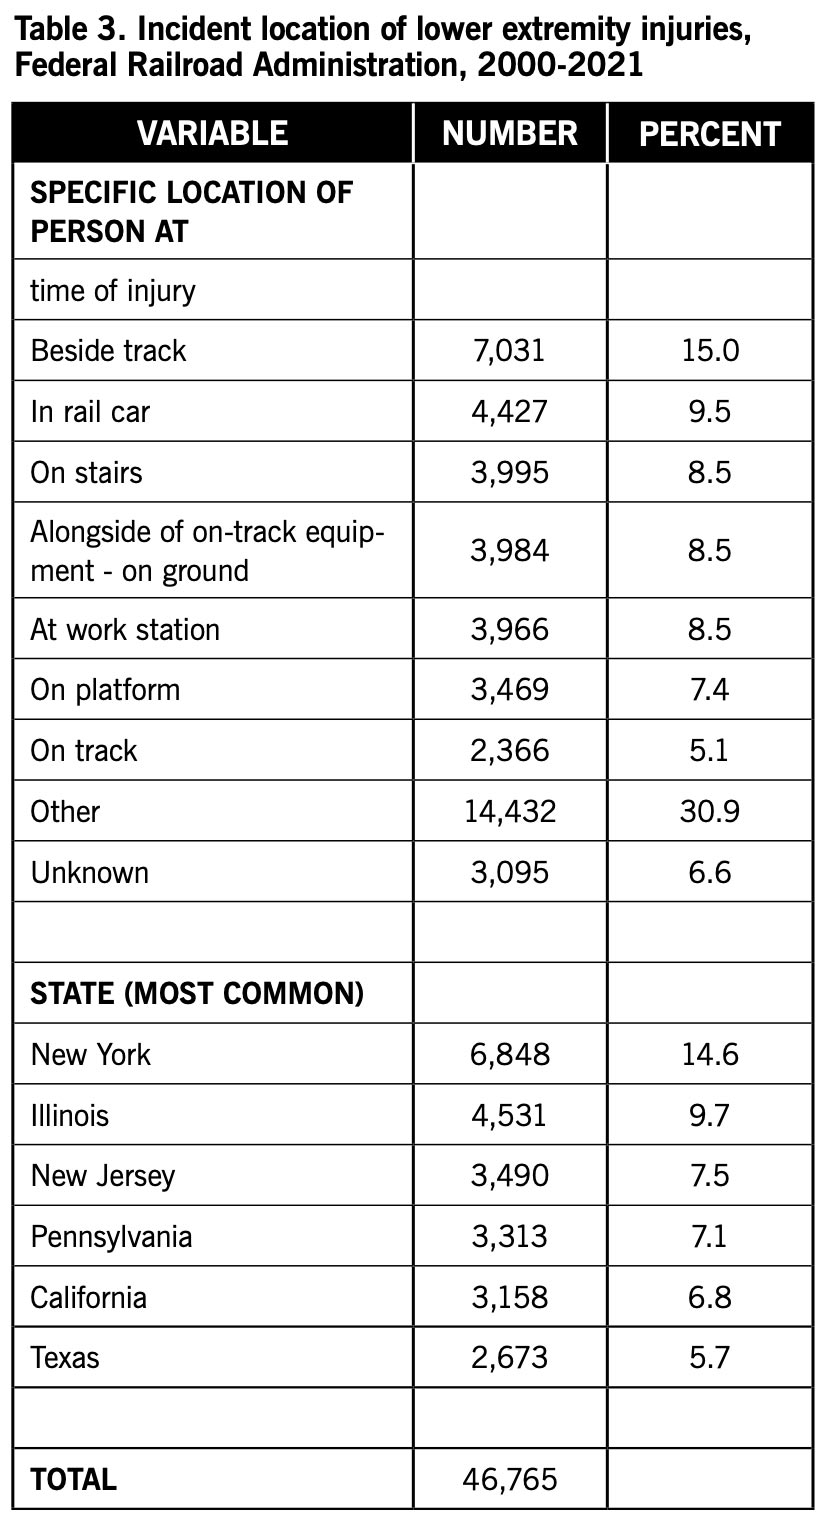
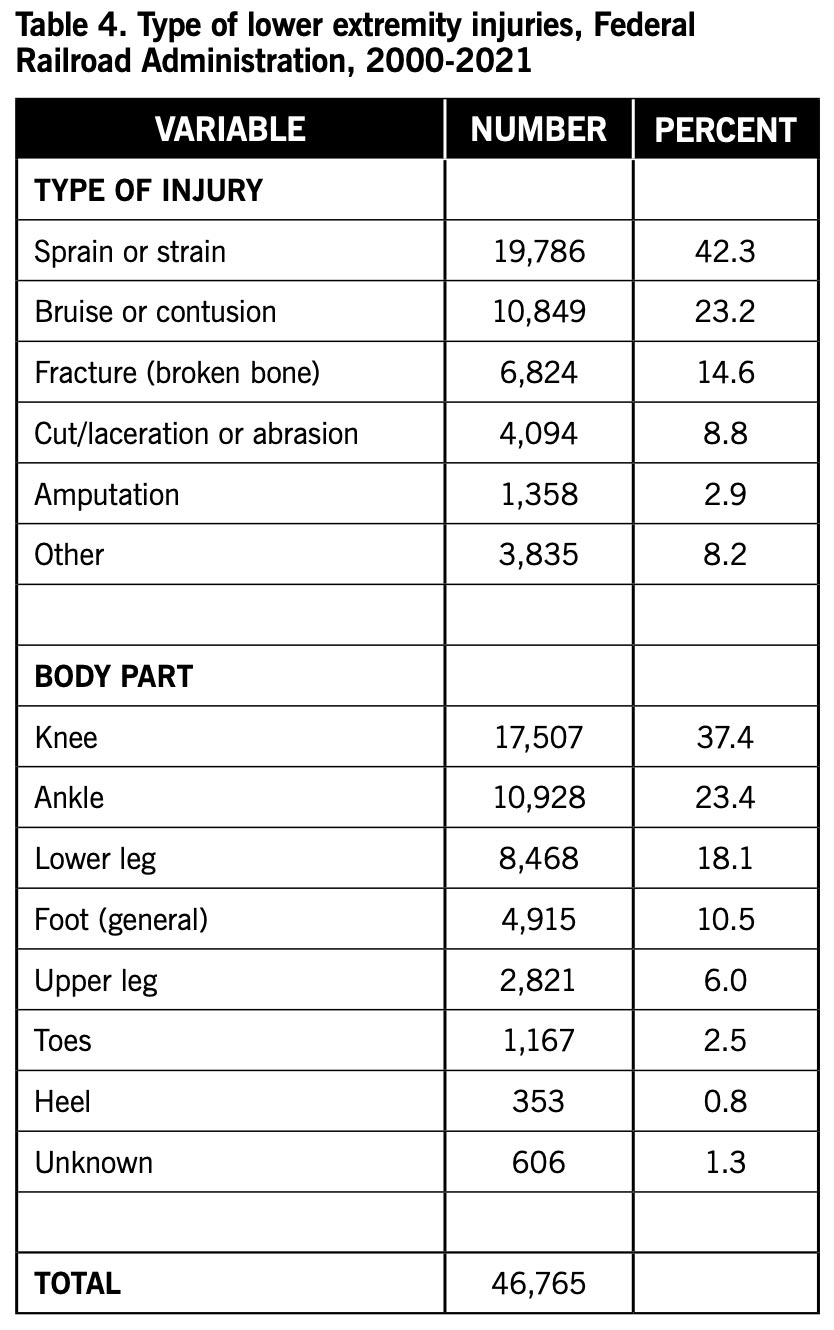
Table 4 shows the distribution of lower extremity injuries by type of injury. The highest proportion of injuries was sprain or strain followed by bruise or contusion, fracture, and laceration or abrasion. The most commonly injured parts of the lower extremity were the knee and ankle. Fatality was reported in 72 (0.2%) of the cases.
Discussion
The annual number of lower extremity injuries declined 38.7% from 2000 to 2019 and 54.6% from 2000 to 2021. US rail transportation employment declined from 206,700 jobs in January 2000 to 144,500 jobs in December 2020, and the industry lost 40,000 jobs between November 2018 and December 2020.1 This decline in jobs may account for at least some of the decline in lower extremity injuries observed. The largest annual decline (32.3%) was observed between 2019 and 2020. This was likely due to the COVID-19 pandemic. A national emergency regarding COVID-19 was declared on March 13, 2020, and various states began to enact stay-at-home orders and close or restrict schools, businesses, parks, playgrounds, and other facilities in March 2020. In subsequent months, stay-at-home orders, closures, and restrictions were lifted or modified, although this varied from state to state.1,10 During April and May 2020, rail transportation employment experienced a loss of 10,000 jobs, a quarter of the loss experienced from November 2018 to December 2020.1
Approximately two-thirds of the patients were age 30-59 years. Since most of persons injured were rail transportation employees or workers, it may be that the majority of employees or workers were age 30-59 years. Alternately, it may be that persons age 30-59 years were more likely to experience a lower extremity injury.
Almost half (47.2%) of the persons were walking, getting off, or stepping down just before the injury, and 46.8% involved the person slipping, falling, or stumbling. Half of the lower extremity injuries occurred beside the track followed by in a rail car, on stairs, alongside of on-track equipment, or at a work station. This information may be useful for identifying those persons most at risk of lower extremity injuries associated with the railroad industry and creating education and prevention activities to reduce risk of these injuries.
The most frequently reported lower extremity injuries were sprain or strain, bruise or contusion, fracture, and laceration or abrasion. In many instances, these types of injuries might be considered relatively minor and not require healthcare management such as hospitalization. However, information on the management of these injuries was not available in the FRA casualty database.
 This study has limitations. It is based on data included in the FRA casualty database. Lower extremity injuries to rail transportation employees, passengers, or others who interact with the railroad industry that were not included in the database would not be included. Furthermore, although the database contains a Narrative field for providing additional details on the injury, this field is often blank or contains very little information. So analyses were limited to the other data fields.
In conclusion, the number of lower extremity injuries reported to FRA declined during 2000-2021, particularly during the COVID-19 pandemic. The majority of patients injured were age 30-59 years, and most were employees on duty. The most commonly reported injuries were sprain or strain, bruise or contusion, fracture, and laceration or abrasion. Almost half of the injuries involved the person slipping, falling, or stumbling.

Mathias B. Forrester, BS, is an independent researcher in Austin, Texas. Now retired, he previously performed public health research for various university and government programs for 34 years.
- Ansell R. Employment in rail transportation heads downhill between November 2018 and December 2020. Monthly Labor Review, U.S. Bureau of Labor Statistics. October 2021. Available at https://www.bls.gov/opub/mlr/2021/article/employment-in-rail-transportation-heads-downhill-between-november-2018-and-december-2020.htm. Accessed Sept. 15, 2022.
- Argerious NB. What is the state of US rail travel in 2019? The Urbanist. January 17, 2019. Available at https://www.theurbanist.org/2019/01/17/what-is-the-state-of-us-rail-travel-in-2019/. Accessed Sept. 15, 2022.
- Wali B, Khattak AJ, Ahmad N. Injury severity analysis of pedestrian and bicyclist trespassing crashes at non-crossings: A hybrid predictive text analytics and heterogeneity-based statistical modeling approach. Accid Anal Prev. 2021;150:105835.
- Khales SD, Chien S, Lee J, Dimitrijevic B. Analysis of the effects of visibility and warning devices on driver injury severity at highway-rail grade crossings considering temporal transferability of data. Int J Inj Contr Saf Promot. 2020;27(2):243-252.
- Zhang M, Khattak AJ, Liu J, Clarke D. A comparative study of rail-pedestrian trespassing crash injury severity between highway-rail grade crossings and non-crossings. Accid Anal Prev. 2018;117:427-438.
- Calabrese C, Mejia B, McInnis CA, France M, Nadler E, Raslear TG. Time of day effects on railroad roadway worker injury risk. J Safety Res. 2017;61:53-64.
- Haleem K, Gan A. Contributing factors of crash injury severity at public highway-railroad grade crossings in the U.S. J Safety Res. 2015;53:23-29.
- Centers for Disease Control and Prevention (CDC). Injuries among railroad trespassers–Georgia, 1990-1996. MMWR Morb Mortal Wkly Rep. 1999;48(25):537-541.
- United States Department of Transportation, Federal Railroad Administration. Accident data, reporting, and investigations. Available at https://railroads.dot.gov/railroad-safety/accident-data-reporting-and-investigations. Accessed Sept. 15, 2022.
- Muccari R, Chow D, Murphy J. Coronavirus timeline: Tracking the critical moments of Covid-19. NBC News. December 29, 2020. Available at https://www.nbcnews.com/health/health-news/coronavirus-timeline-tracking-critical-moments-covid-19-n1154341. Accessed Sept. 15, 2022.