
 By Mathias B. Forrester, BS
Background: First available in the United States (US) in 2015, hoverboards have become popular, with millions purchased. There is risk of injury when operating hoverboards. This study characterized hoverboard-related lower extremity injuries treated at United States (US) emergency departments (EDs).
Methods: An analysis was performed of hoverboard-related lower extremity injuries using data from the National Electronic Injury Surveillance System of the US Consumer Product Safety Commission during 2000-2022.
Results: There were an estimated 26,622 hoverboard-related lower extremity injuries treated at US hospital EDs during the time period. The most common circumstances leading to lower extremity injury were 73.3% fell off the hoverboard, 6.8% collision while on the hoverboard, and 5.7% run over by the hoverboard. The patient age distribution was 5.9% 0-5 years, 50.5% 6-12 years, 15.8% 13-19 years, and 27.8% 20 years and older. The most common types of injuries were fracture (28.0%), strain or sprain (26.9%), and contusion or abrasion (21.5%). The affected body part was 27.2% ankle, 27.2% foot, 16.4% toe, 16.2% knee, 11.6% lower leg (not including knee or ankle), and 1.4% upper leg. The patient was treated or examined at the ED and then released in 95.3% of the estimated injuries.
Conclusions: Hoverboard-related lower extremity injuries occur under a variety of circumstances, the most common being falling off the hoverboard, collision while on the hoverboard, and run over by the hoverboard. Most patients were children. The most common type of injury was fracture, followed by strain or sprain and contusion or abrasion. The majority of patients were treated or examined in the ED and released.
A hoverboard is a battery-powered, hands-free, self-balancing vehicle consisting of two wheels connected by a long board.1,2 To operate a hoverboard, a person stands on the long board and shifts their weight to activate gyroscopic pads that cause the vehicle to move without pedaling. Hoverboards first became available in the United States (US) in 2015;1,2 since then, they have become popular in the US, with millions purchased.3
A person operates a hoverboard by balancing without using their hands, and the vehicle can turn at speeds of 15 mph or more. For these and other reasons, injuries may occur when using hoverboards.1,3-8 Studies have found fractures to be the most common type of hoverboard-related injury and the upper extremity to be the body part most often involved in hoverboard-related injuries.1,4,5,7,8 Although the majority of injuries result from a fall, a portion may be due to other circumstances.7,8 Furthermore, fires or explosions related to hoverboard batteries have been reported.9,10
While most hoverboard-related injuries involve the upper extremity, a portion involve the lower extremity.4,5 The objective of this study was to characterize hoverboard-related lower extremity injuries treated at US hospital emergency departments (EDs).
Methods
This study used data from the National Electronic Injury Surveillance System (NEISS) website (https://www.cpsc.gov/cgibin/NEISSQuery/home.aspx). The NEISS is operated by the US Consumer Product Safety Commission (CPSC) and collects data on consumer product-related injuries from the EDs of a stratified random sample of 100 hospitals from the more than 5,000 hospitals in the US. The random sample is stratified by hospital size, geographic location, and hospital type (general and pediatric hospitals). Professional NEISS coders view the medical charts at participating hospitals and, for patients with injuries that meet NEISS inclusion criteria, collect and code information such as treatment date; patient age, sex, and race; injury diagnosis and body part injured; discharge disposition; consumer product(s) involved in the injury; location where the incident occurred; and a brief narrative describing the incident.11,12 Data are publicly available and de-identified; therefore, the study is exempt from institutional review board approval. The NEISS database has been used previously to examine hoverboard-related injuries;3,5,6,13,14 however, none of these studies had focused on lower extremity injuries.

*Patient sex was not reported in all cases.
Estimate = Weighted estimate (sum of the Weight numeric field in the National Electronic Injury Surveillance System database). The numbers in the Weight field are not whole numbers but include decimals. As a result of rounding to whole numbers when performing analyses, the sum of the estimates for a given variable might not equal the total. The Consumer Product Safety Commission considers an estimate unstable and potentially unreliable when the number of records used is <20 or the estimate is <1,200.
Cases were hoverboard-related lower extremity injuries reported to the NEISS database during 2015-2022; 2015 was chosen as the start of the study because that was the year hoverboards first because available in the US. The publicly available NEISS database contains three numeric fields for coding the product involved in the injury (Product_1, Product_2, Product_3). However, there is no product code specific to hoverboards. The NEISS database contains a text field (field name Narrative) that provides a brief summary of the circumstances of the injury. The NEISS database was searched for all records that included the letter groups “hover,” “hoover,” “hovr,” or “hoovr” in the Narrative field. The Narrative fields of the resulting records were individually examined, and any records that appeared to involve a hoverboard-related injury were included in the study. That the injury involved a lower extremity was based on the Body_Part numeric field (a field that documents the injured body part) containing codes for a lower extremity (upper leg, knee, lower leg, ankle, foot, toe). The NEISS database contains another numeric field for documenting whether a second body part was injured (Body_Part_2); however, this field was only added in 2018,12 although this field does not appear to have been used until 2019. For consistency over the entire study period, only the Body_Part field was examined. (Thirty-four cases had a lower extremity coded in the Body_Part_2 field but not in the Body_Part field during 2019-2022.)
The variables examined were treatment year and month (grouped into three-month periods), patient age and sex, location where the incident occurred, circumstance of the injury, type of injury (diagnosis), affected body part, and disposition. The NEISS database does not have a field for circumstance of the injury. The circumstance of the injury was identified by review of the Narrative field and was assigned to one of the following groups: fell off hoverboard, collision while on hoverboard, ran over by hoverboard, body part caught in hoverboard, tripped over hoverboard, hit hoverboard, hit by person on hoverboard, hit by hoverboard, while carrying hoverboard, hoverboard caused fire, other, and unknown.
Analyses were performed using Microsoft 365 Access and Excel (Microsoft Corporation, Redmond, Washington, US). For the selected variables, the distribution of the national injury estimates was determined for both total hoverboard-related injuries affecting any body part and the subset of hoverboard-related lower extremity injuries. Comparisons were made between the two groups for the studied variables by calculating the percent of total injuries that were lower extremity injuries. National injury estimates were calculated by summing the values in the Weight numeric field in the publicly available NEISS database. The CPSC considers an estimate unstable and potentially unreliable when the estimate is <1,200.11
Results
An estimated 26,622 hoverboard-related lower extremity injuries were treated at US hospital EDs during 2015-2022, representing 16.4% of the 162,711 total estimated hoverboard-related injuries. The estimated number of lower extremity injuries by body part was 7,233 (27.2%) ankle, 7,232 (27.2%) foot, 4,373 (16.4%) toe, 4,321 (16.2%) knee, 3,100 (11.6%) lower leg (not including knee or ankle), and 363 (1.4%) upper leg.
The first hoverboard-related lower extremity injury was treated in October 2015. Table 1 shows the estimated annual number of injuries. The estimated number of lower extremity injuries was greatest in 2016 then decreased over the rest of the study period. In contrast, the estimated number of total injuries increased to a peak in 2020 before declining over the next two years. The percent of total estimated injuries consisting of lower extremity injuries declined from 22.8% in 2015 to 14.1% in 2019 and ranged between 13.9% and 14.6% during 2020-2022.
Excluding 2015, during which hoverboard-related injuries were only treated during the last 3 months, there were an estimated 26,089 hoverboard-related lower extremity injuries during 2016-2022. The distribution of estimated hoverboard-related lower extremity injuries by season for this 7-year period was 8,572 (32.9%) in December-February, 6,903 (26.5%) in March-May, 5,680 (21.8%) in June-August, and 4,934 (18.9%) in September-November. The months with the greatest estimated number of lower extremity injuries were December (estimate = 3,535, 13.6%) and January (estimate = 3,170, 12.2%).
Table 1 presents the distribution of hoverboard-related injuries by patient demographics. Approximately half of the patients with lower extremity injuries were age 6-12 years; 72.2% of the patients were age 0-19 years and 27.8% were age 20 years and older. A higher proportion of patients were female.

Please see footnote in Table 1.
Table 2 shows the distribution of hoverboard-related injuries by location and circumstances of the incident. Of those estimated lower extremity injuries with a recorded location, the majority occurred at home with the next most common locations being street or highway followed by other public property. Most estimated lower extremity injuries occurred when the patient fell off the hoverboard; the next most common circumstances were collision while on the hoverboard and ran over by the hoverboard. The proportion of total estimated injuries consisting of lower extremity injuries varied by the circumstance of the injury. For example, the lower extremity rates for collision while on the hoverboard (44.4%) and ran over by the hoverboard (56.3%) were 3.3 and 4.2 times that for fell off the hoverboard (13.3%), respectively.
Table 3 provides the distribution of hoverboard-related injuries by type of injury and patient disposition. The most common diagnoses for lower extremity injuries were fracture, strain or sprain, and contusion or abrasion. Estimated lower extremity injuries comprised a higher proportion of total estimated injuries for strains and sprains (36.5%) and contusions or abrasions (20.3%) than for fractures (11.5%). The majority of patients were treated or examined at the ED and released.

Discussion
This study described the pattern of hoverboard-related lower extremity injuries treated at US hospital EDs and compared these to total hoverboard-related injuries. This information is important because knowledge of the pattern of hoverboard-related injuries allows healthcare providers to allocate resources to help manage these injuries. In addition, injury prevention programs can design the information they provide to target particular populations.
This study found that the proportion of total injuries represented by lower extremities varied with the injury circumstances. Of the three most commonly reported circumstances, lower extremities represented only 13.3% of injuries resulting from falling off the hoverboard but 44.4% of the injuries resulting from a collision while on the hoverboard and 56.3% of the injuries resulting from being run over by the hoverboard. And lower extremity injuries accounted for more than 13.3% of the total injuries for six of the nine remaining circumstances. These differences in rates likely reflect differences in the specific mechanics of the circumstances with some of the circumstances more likely to result in lower extremity injuries than others.
While the estimated annual number of total hoverboard-related injuries increased from 2015 to 2020 and then declined, the estimated annual number of lower extremity injuries was greatest in 2016 and decreased through the rest of the time period. Consequently, the proportion of estimated total injuries represented by lower extremity injuries declined through 2019 and then remained relatively constant through 2022. One possible explanation for this pattern is the introduction of the second data field for documenting injured body parts in 2019. It could be that, from 2019 onward, a portion of lower extremity injuries were documented in the second data field instead of the first. However, there were only 34 cases reported during 2019-2022 where a lower extremity was documented in the second data field and not in the first. Thus, this is not likely to significantly account for the decline in the proportion of total injuries represented by lower extremities.
A more likely explanation would be temporal changes in the circumstances resulting in hoverboard-related injuries. If the pattern of circumstances resulting in injuries changed over time, then the relative contribution of lower extremities to total injuries might likewise change. The proportion of estimated total injuries resulting from collision or being run over was 5.3% during 2015-2018 but 3.2% during 2019-2022.
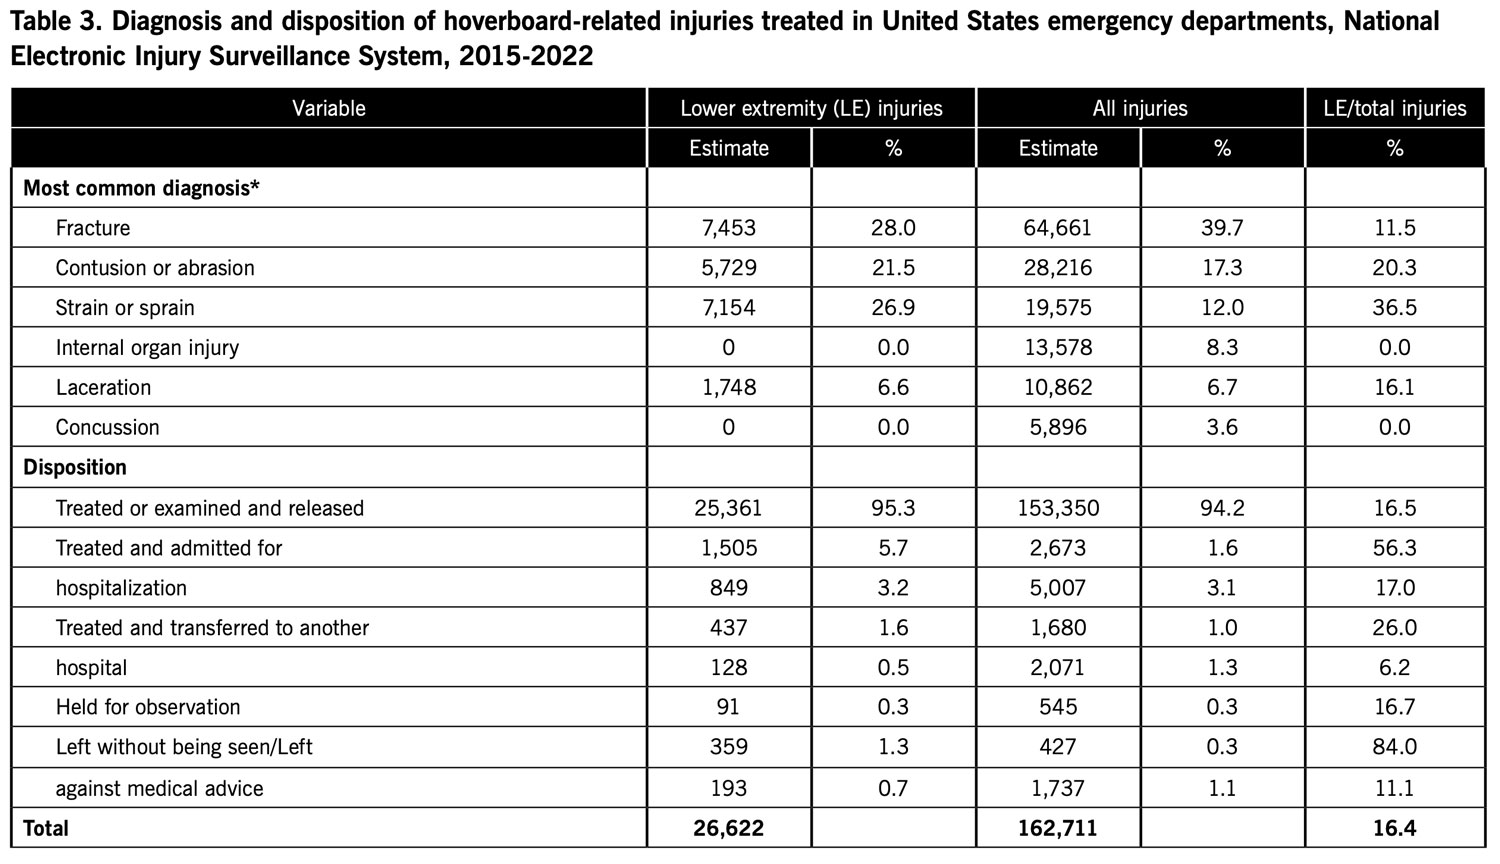
*Diagnosis includes only diagnosis listed in the first of two diagnosis fields in the National Electronic Injury Surveillance System database. The second diagnosis field was only used for records during 2019-2022. Please see footnote in Table 1.
Estimated lower extremity injuries were seasonal, with 25.7% reported in December and January. Other studies of hoverboard-related injuries have reported a similar pattern, attributing the surge in injuries during December and January to hoverboards being received as Christmas gifts.3,13
Over half of the estimated lower extremity injuries involved patients age 6-12 years and 72.2% age 0-19 years. Previous studies likewise observed that most patients were children.1,5,13,14 Children may be more likely to use hoverboards or more likely to experience injuries resulting in treatment at hospital EDs.
Fractures, strains or sprains, and contusions or abrasions accounted for 76.4% of the estimated lower extremity injuries. In most cases, these types of injuries might not be expected to require hospital admission or transfer to another hospital. This study found that 95.3% of the patients were treated or examined in the ED and released.
Various recommendations have been offered to prevent hoverboard-related injuries.1,4 Appropriate protective gear such as wrist guards should be used when operating a hoverboard. Children should use hoverboards under adult supervision. Use of hoverboards in confined spaces should be avoided. Considering that a high proportion of injuries occur around Christmas, educational materials and warnings should be disseminated around that time.
This study has various limitations. Hoverboard-related injuries were identified by searching for letter combinations in the Narrative text field. If these letter combinations were not used for hoverboard-related injuries, then these cases would not have been included in the analysis. This study only included patients who were treated at hospital EDs and not patients who were treated at other locations. Inclusion of this latter group of patients would provide a more complete understanding of hoverboard-related lower extremity injuries.
In conclusion, hoverboard-related lower extremity injuries occur under a variety of circumstances, the most common being falling off the hoverboard, collision while on the hoverboard, and run over by the hoverboard. The specific circumstances differed in the risk of causing lower extremity injury compared to injury of any body part. The majority of patients were children. The most common type of injury was fracture, followed by strain or sprain and contusion or abrasion. The majority of patients were treated or examined in the ED and released.
Mathias B. Forrester, BS, is an independent researcher in Austin, Texas. Now retired, he previously performed public health research for various university and government programs for 38 years.
- Do MT, McFaull S, Cheesman J, Mersereau T, Rao DP, Crain J, Thompson W. Emergency department presentations for hoverboard-related injuries: The electronic Canadian Hospitals Injury Reporting and Prevention Program, 2015 to 2016. Heal Promot Chronic Dis Prev Can. 2016;36(12):316-317.
- Ying J, Cao S: Patent analyzing system. US D737,723S. US Patent and Trademark Office, September 1, 2015. Available at: https://patentimages.storage.googleapis.com/e2/e4/33/edbad2cd400d33/USD737723.pdf. Accessed May 19, 2023.
- Gudeman A, Loder RT, Figueras J, Osterbur T, Fitzgerald R. Seasonal differences in emergency department visits for scooter associated injuries. Chronobiol Int. 2022;39(2):241-248.
- Hosseinzadeh P, Devries C, Saldana RE, Scherl SA, Andras LM, Schur M, Shuler FD, Mignemi M, Minaie A, Chu A, Fornari ED, Frick SL, Caird MS, Riccio AI, Pierz K, Plakas C, Herman MJ. Hoverboard injuries in children and adolescents: Results of a multicenter study. J Pediatr Orthop B. 2019;28(6):555-558.
- McIlvain C, Hadiza G, Tzavaras TJ, Weingart GS. Injuries associated with hoverboard use: A review of the National Electronic Injury Surveillance System. Am J Emerg Med. 2019;37(3):472-477.
- Bandzar S, Funsch DG, Hermansen R, Gupta S, Bandzar A. Pediatric hoverboard and skateboard injuries. Pediatrics. 2018;141(4):e20171253.
- Ho M, Horn BD, Lin IC, Chang B, Carrigan RB, Shah A. Musculoskeletal injuries resulting from use of hoverboards: Safety concerns with an unregulated consumer product. Clin Pediatr (Phila). 2018;57(1):31-35.
- Monteilh C, Patel P, Gaffney J. Musculoskeletal injuries associated with hoverboard use in children. Clin Ped iatr (Phila). 2017;56(10):909-911.
- United Sates Consumer Product Safety Commission. Self-balancing scooters/hoverboards recalled by 10 firms due to fire hazard. 2016. Available at http://www.cpsc.gov/en/Recalls/2016/Self-Balancing-Scooters-Hoverboards-Recalled-by-10-Firms/. Accessed May 19, 2023.
- United Sates Consumer Product Safety Commission. Statement from the U.S. CPSC Chairman Elliot F. Kaye on the safety of hoverboards. December 16, 2015. Available at https://www.cpsc.gov/about-cpsc/chairman/elliot-f-kaye/statements/statement-us-cpsc-chairman-elliot-f-kayesafety. Accessed May 19, 2023.
- United States Consumer Product Safety Commission. National Electronic Injury Surveillance System (NEISS). Available at https://www.cpsc.gov/Research–Statistics/NEISS-Injury-Data/Explanation-Of-NEISS-Estimates-Obtained-Through-The-CPSC-Website. Accessed May 19, 2023.
- United States Consumer Product Safety Commission. NEISS Coding Manual. January 2021. Available at https://www.cpsc.gov/s3fs-public/January-2021-NT-CPSC-only-NEISS-Coding-Manual.pdf?xa_nMM1kB4SGpuSMOwf0NHkkkIqNcn8F. Accessed May 19, 2023.
- Wu BW, Lee KC, Hsiung MW, Karlis V. What are the predictors of craniomaxillofacial injuries from hoverboard accidents? J Oral Maxillofac Surg. 2020;78(11):2027-2031.
- Siracuse BL, Ippolito JA, Gibson PD, Beebe KS. Hoverboards: A new cause of pediatric morbidity. Injury. 2017;48(6):1110-1114.