
 By Mathias B. Forrester, BS
Tens of thousands of shopping cart-related injuries are treated at United States (US) hospital emergency departments (EDs) each year. This study described shopping cart-related lower extremity injuries treated at US hospital EDs.
Methods: An analysis was performed of shopping cart-related lower extremity injuries reported to the National Electronic Injury Surveillance System during 2000-2023. National injury estimates were calculated for selected variables.
Results: An estimated 144,935 shopping cart-related lower extremity injuries were treated at US hospital EDs during 2000-2023, 17.5% of the estimated 828,254 total shopping cart-related injuries affecting any body part. The distribution of the lower extremity injuries by body part was 25.8% lower leg, 20.2% knee, 18.7% foot, 16.2% ankle, 13.2% toe, and 5.9% upper leg. The injury mechanisms were 37.8% hit or hit by shopping cart; 21.1% fall, trip, or slip and shopping cart involved (patient not in or on shopping cart); 11.5% run over by shopping cart; and 29.7% all other or unknown. The patients were 12.5% 0-5 years, 10.0% 6-19 years, and 77.5% 20 years and older; 72.0% of the patients were female, and 28.0% were male. The injury type was 41.4% contusion or abrasion, 15.1% strain or sprain, 13.0% fracture, 8.8% laceration, and 21.8% other/not stated; 94.3% of the patients were treated or examined at the ED and released.
Conclusion: Shopping cart-related lower extremity injuries treated at US hospital EDs occurred via a variety of mechanisms, the most common being hit or hit by shopping cart; fall, trip, or slip and shopping cart involved (patient not in or on shopping cart); and run over by shopping cart. The majority of patients were age 20 years or older, and most patients were female. The most common type of injury was contusion or abrasion, followed by strain or sprain and fracture. Most patients were treated or examined in the ED and released.
A shopping cart, also called by other terms such as basket, buggy, carriage, wagon, or wheelbasket in the United States (US), is a wheeled cart for people to transport items, primarily merchandise, inside or from a store. Most shopping carts have 4 wheels and are comprised of metal or a combination of metal and plastic. Shopping carts come in a variety of sizes and designs. The standard shopping cart is the most common type of shopping cart found in (and owned by) supermarkets and grocery stores. It typically features a frame, a handlebar for pushing, and a basket or compartment for holding items. The child-friendly shopping cart is designed to accommodate young children; it may feature a built-in child seat or a designated area where a child may sit. The double-decker shopping cart has 2 baskets or compartments stacked on top of each other, allowing shoppers to separate items. The mini shopping cart is a smaller-sized cart designed for shoppers who only need a few items or who have limited space for shopping. The electric shopping cart is primarily an electric wheelchair or scooter with a basket and is for persons with disabilities.1,2 There also is the personal shopping cart (typically owned by the individual), which is generally a smaller, folding cart, sometimes with only 2 wheels, that people may use to transport merchandise to their homes.
Tens of thousands of shopping cart-related injuries are treated at US hospital emergency departments (EDs) each year.3,4 These injuries occur by a variety of mechanisms, such as falls out of a shopping cart, cart tip overs, patient body part caught in a cart (entrapment), being struck or run over by a cart, and running into or falling over a cart.3,5-7 Common shopping cart-related injuries include closed head injuries or concussions, internal injuries, lacerations, fractures, and contusions or abrasions and can affect all parts of the body, including the lower extremity.3,4,7 Death may also result from shopping cart-related injuries.8
Much of the literature on shopping cart-related injuries has focused on the pediatric population.3-7,9,10 The objective of this study was to describe shopping cart-related lower extremity injuries affecting patients of all ages.
Methods
This retrospective, descriptive study used data from the National Electronic Injury Surveillance System (NEISS), available at https://www.cpsc.gov/cgibin/NEISSQuery/home.aspx. The NEISS database has been described in detail in Lower Extremity Review previously.11 In brief, NEISS is operated by the US Consumer Product Safety Commission (CPSC) and is a database of consumer product-related injuries collected from a representative sample of approximately 100 US hospital EDs. National estimates are calculated from database records according to the sample weight assigned to each case based on the inverse probability of the hospital being selected for the NEISS sample.12,13 The data are publicly available and de-identified, so the study is exempt from institutional review board approval. Previous studies have used NEISS data to examine shopping cart-related injuries; however, these studies examined only the pediatric population and did not focus on injuries of the lower extremity.3,4,9
Cases were shopping cart-related injuries reported to the NEISS during 2000-2023. Cases were identified in a multi-stage process. First, all records with product code 1679 (Grocery or shopping carts, unpowered) in the Product_1, Product_2, or Product_3 numeric fields were identified. There was no product code specifically for powered grocery or shopping carts. (The Product_3 field was added in 2018 but does not appear to have been used until 2019;13 only 9 of the records included in the study had product code 1679 in this field.) Next, the Narrative field (a text field that briefly summarizes the circumstances of the injury) for each record was reviewed to identify those records that met the study criteria as well as attempt to identify the mechanism of the injury. Injuries only peripherally related to the shopping cart (eg, being hit by an object that fell from the shopping cart, hitting an object while riding in a shopping cart, being injured while an object was being placed into or removed from a shopping cart) were excluded from the study. An exception was made for injuries that occurred when the patient was being placed in or removed from a shopping cart or the patient was placing another individual (usually a child) into or removing them from a shopping cart, which were included in the study. Injuries involving all types of shopping carts were included in the study because the specific type of shopping cart was not often noted in the Narrative field.
The mechanism of injury was grouped into 2 broad categories: (1) fall, trip, or slip mentioned or (2) fall, trip, or slip not mentioned. The mechanism of injury was further divided into the following categories:
- Fall, trip, or slip mentioned:
- fell from or in shopping cart (no mention shopping cart tipped or fell over)
- shopping cart tipped or fell over (patient in or on shopping cart)
- fall, trip, or slip and shopping cart involved (patient not in or on shopping cart)
- Fall, trip, or slip not mentioned:
- hit or hit by shopping cart
- run over by shopping cart
- shopping cart tipped or fell over (no mention patient in or on cart)
- entrapment of body part in shopping cart or between shopping cart and another object
- pushed, pulled, lifted, or carried shopping cart (no other factor mentioned)
- other or unknown mechanism
If the injury involved a mechanism in the fall, trip, or slip not mentioned group but a fall, trip, or slip occurred, then it was coded in the fall, trip, or slip mentioned group. For example, if a patient was hit by a shopping cart and fell, the record was coded in the fall, trip, or slip mentioned group. If multiple mechanisms of injury were described in the Narrative field, such as the patient being hit by a shopping cart and then becoming entrapped in a shopping cart, the first mechanism to occur (hit by a shopping cart) in the sequence was coded.
The variables examined were injury mechanism, treatment year and month (grouped into three-month periods), patient age and sex, location of incident, type of injury (diagnosis), affected body part, and disposition. The NEISS database contains 2 numeric fields for coding the affected body part (Body_Part and Body_Part_2) and two numeric fields for coding the type of injury or diagnosis (Diagnosis and Diagnosis_2). The Body_Part_2 and Diagnosis_2 fields were added in 2018, although they do not appear to have been used until 2019.13 For consistency over the entire study period, the Body_Part and Diagnosis fields alone was examined for the analysis.
Analyses were performed using Microsoft 365 Access and Excel (Microsoft Corporation, Redmond, Washington, US). For the selected variables, the distribution of the national injury estimates was determined for both total shopping cart-related injuries affecting any body part and the subset of shopping cart-related lower extremity injuries. Comparisons were made between the 2 groups for the studied variables by calculating the percent of total injuries that were lower extremity injuries. National injury estimates were calculated by summing the values in the Weight numeric field in the publicly available NEISS database. The CPSC considers an estimate unstable and potentially unreliable when the estimate is <1,200.12
Results
There were an estimated 144,935 shopping cart-related lower extremity injuries treated at US hospital EDs during 2000-2023, representing 17.5% of the 828,254 total estimated shopping cart-related injuries affecting any body part. The distribution of the lower extremity injuries by body part was 37,426 (25.8%) lower leg, 29,227 (20.2%) knee, 27,060 (18.7%) foot, 23,548 (16.2%) ankle, 19,114 (13.2%) toe, and 8,560 (5.9%) upper leg.
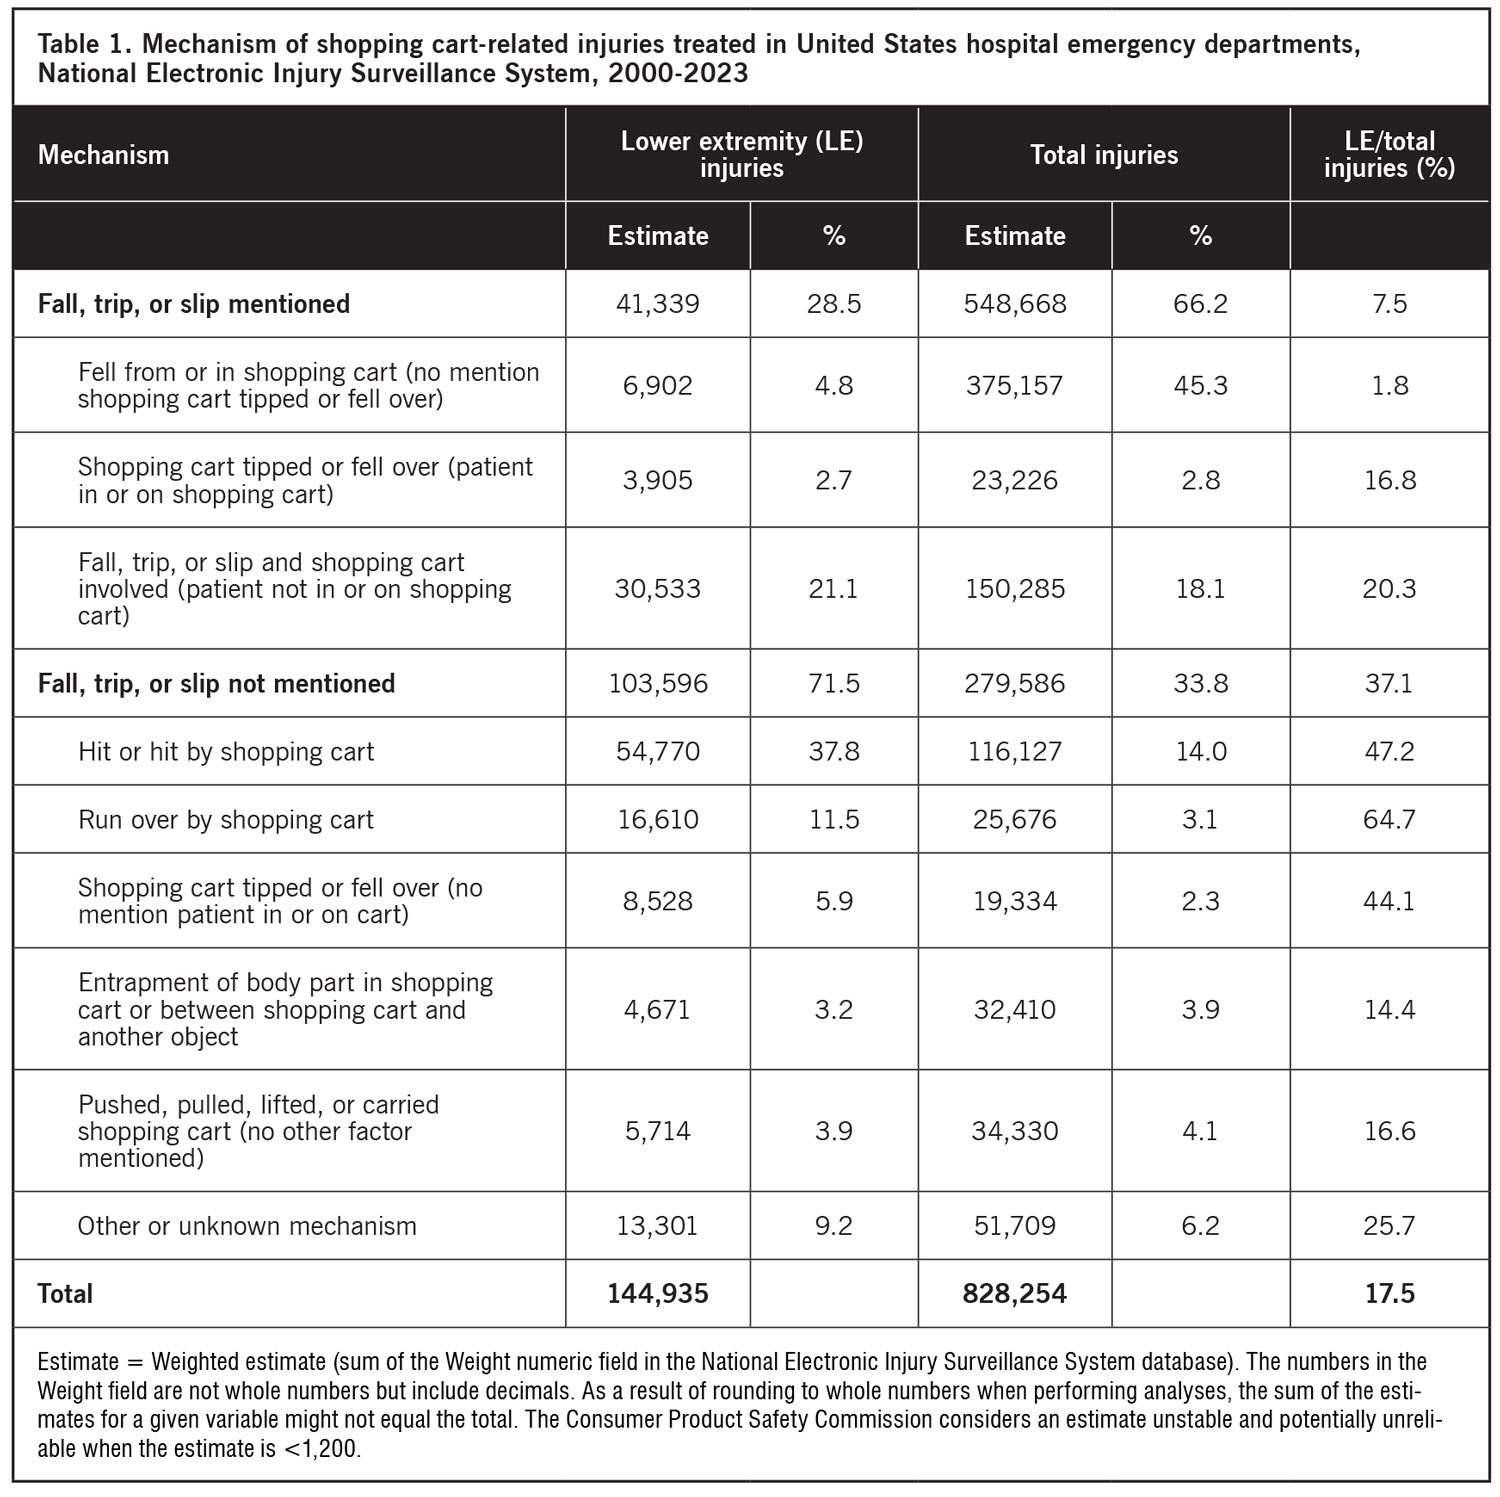
Table 1 shows the distribution of shopping cart-related injuries by injury mechanism. A fall, trip, or slip was mentioned in most total injuries; however, a fall, trip, or slip was not mentioned in the majority of lower extremity injuries. For total injuries, the most common mechanisms of injuries were fell from or in shopping cart (no mention shopping cart tipped or fell over); fall, trip, or slip and shopping cart involved (patient not in or on shopping cart); and hit or hit by shopping cart. For lower extremity injuries, the most common mechanisms were hit or hit by shopping cart; fall, trip, or slip and shopping cart involved (patient not in or on shopping cart); and run over by shopping cart.
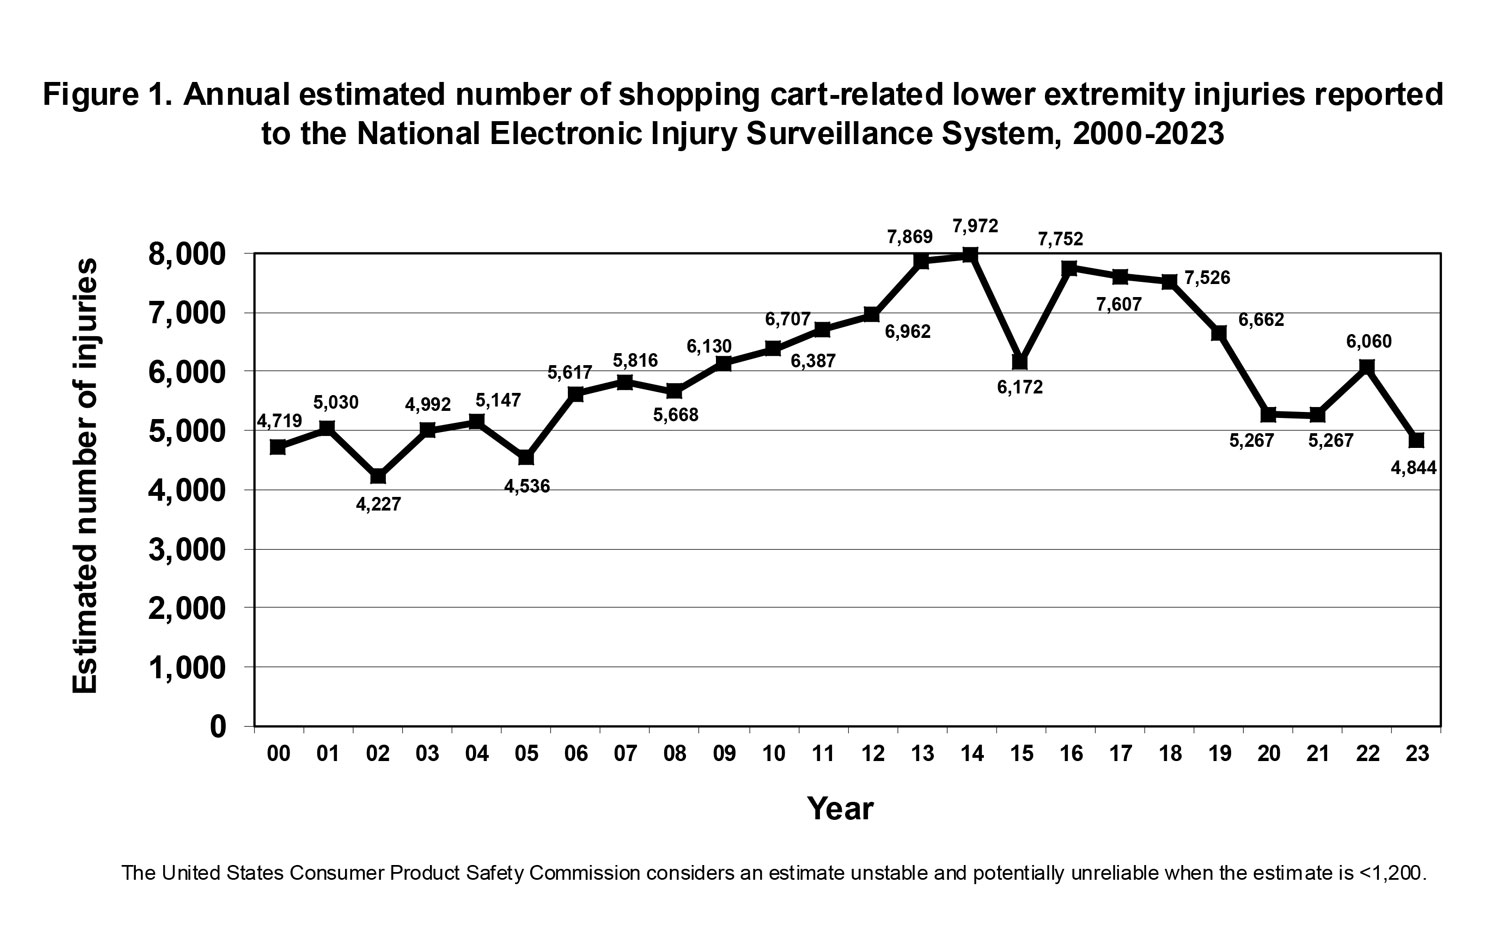
When the annual estimated number of shopping cart-related lower extremity injuries was examined (Figure 1), the estimated number of injuries increased from 4,719 in 2000 to 7,972 in 2014 and then declined to 4,844 in 2023. The annual estimated number of total injuries demonstrated a similar pattern, increasing from 32,388 in 2000 to 40,581 in 2010 and then decreasing to 27,532 in 2023. The proportion of total injuries comprised by lower extremities was 18,969/133,135 (14.2%) during 2000-2003, 21,116/140,392 (15.0%) during 2004-2007, 24,891/152,938 (16.3%) during 2008-2011, 28,975/151,795 (19.1%) during 2012-2015, 29,547/144,177 (20.5%) during 2016-2019, and 21,437/105,815 (20.3%) during 2020-2023.
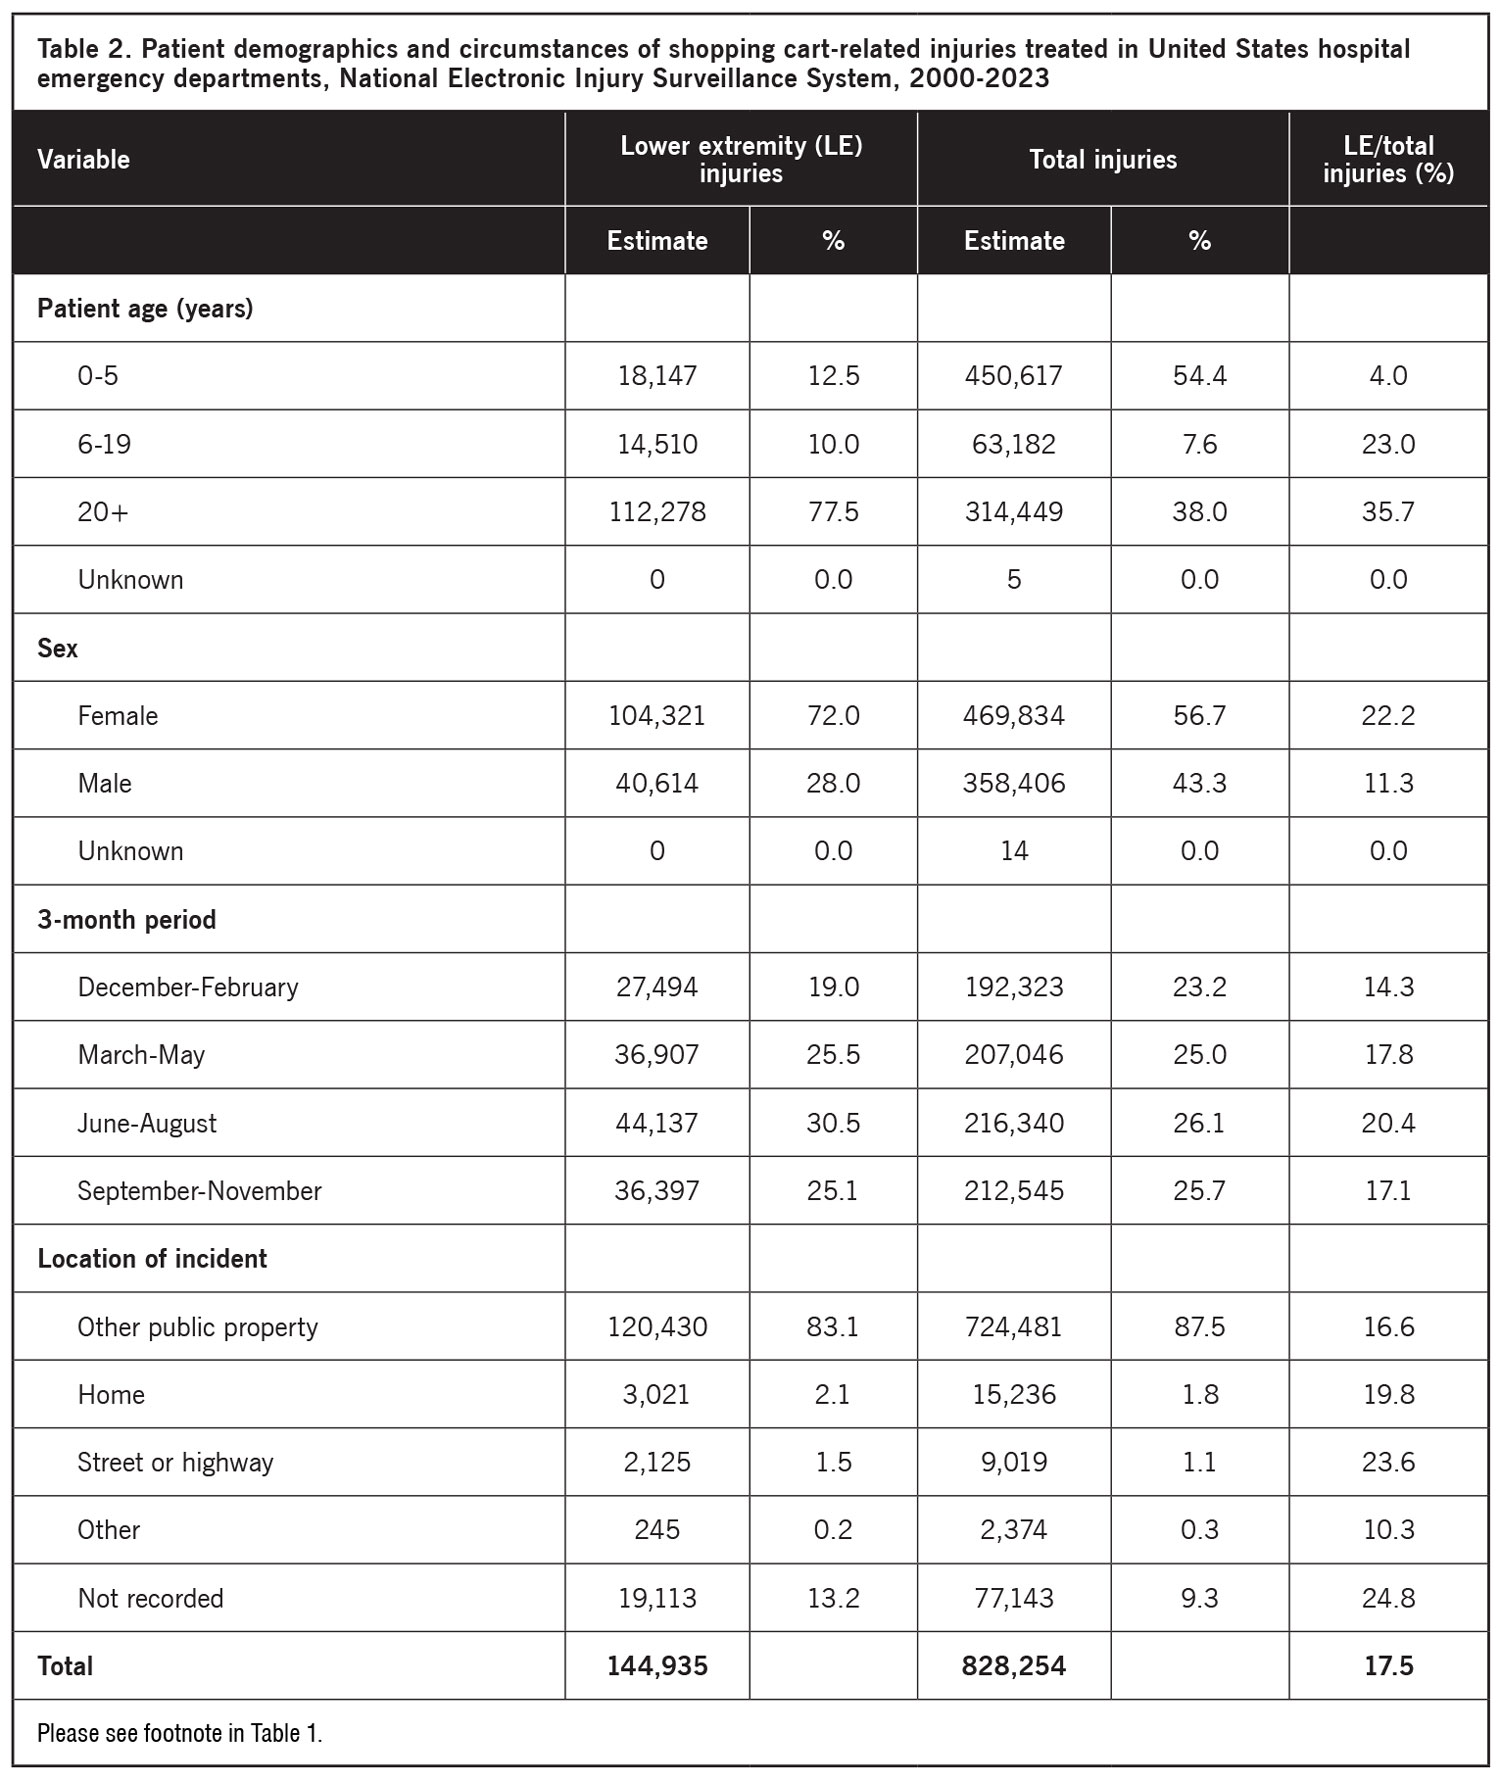
Table 2 presents the distribution of shopping cart-related injuries by patient demographics and injury circumstances. While most patients with total injuries were age 0-5 years, most patients with lower extremity injuries were age 20 years and older. The majority of patients in both groups were female; however, this proportion was higher among patients with lower extremity injuries. The highest proportion of lower extremity injuries were treated in June-August, and the lowest proportion were treated in December-February. Total injuries did not exhibit a similar seasonal pattern. For both total injuries and lower extremity injuries, most injuries occurred at other public property.

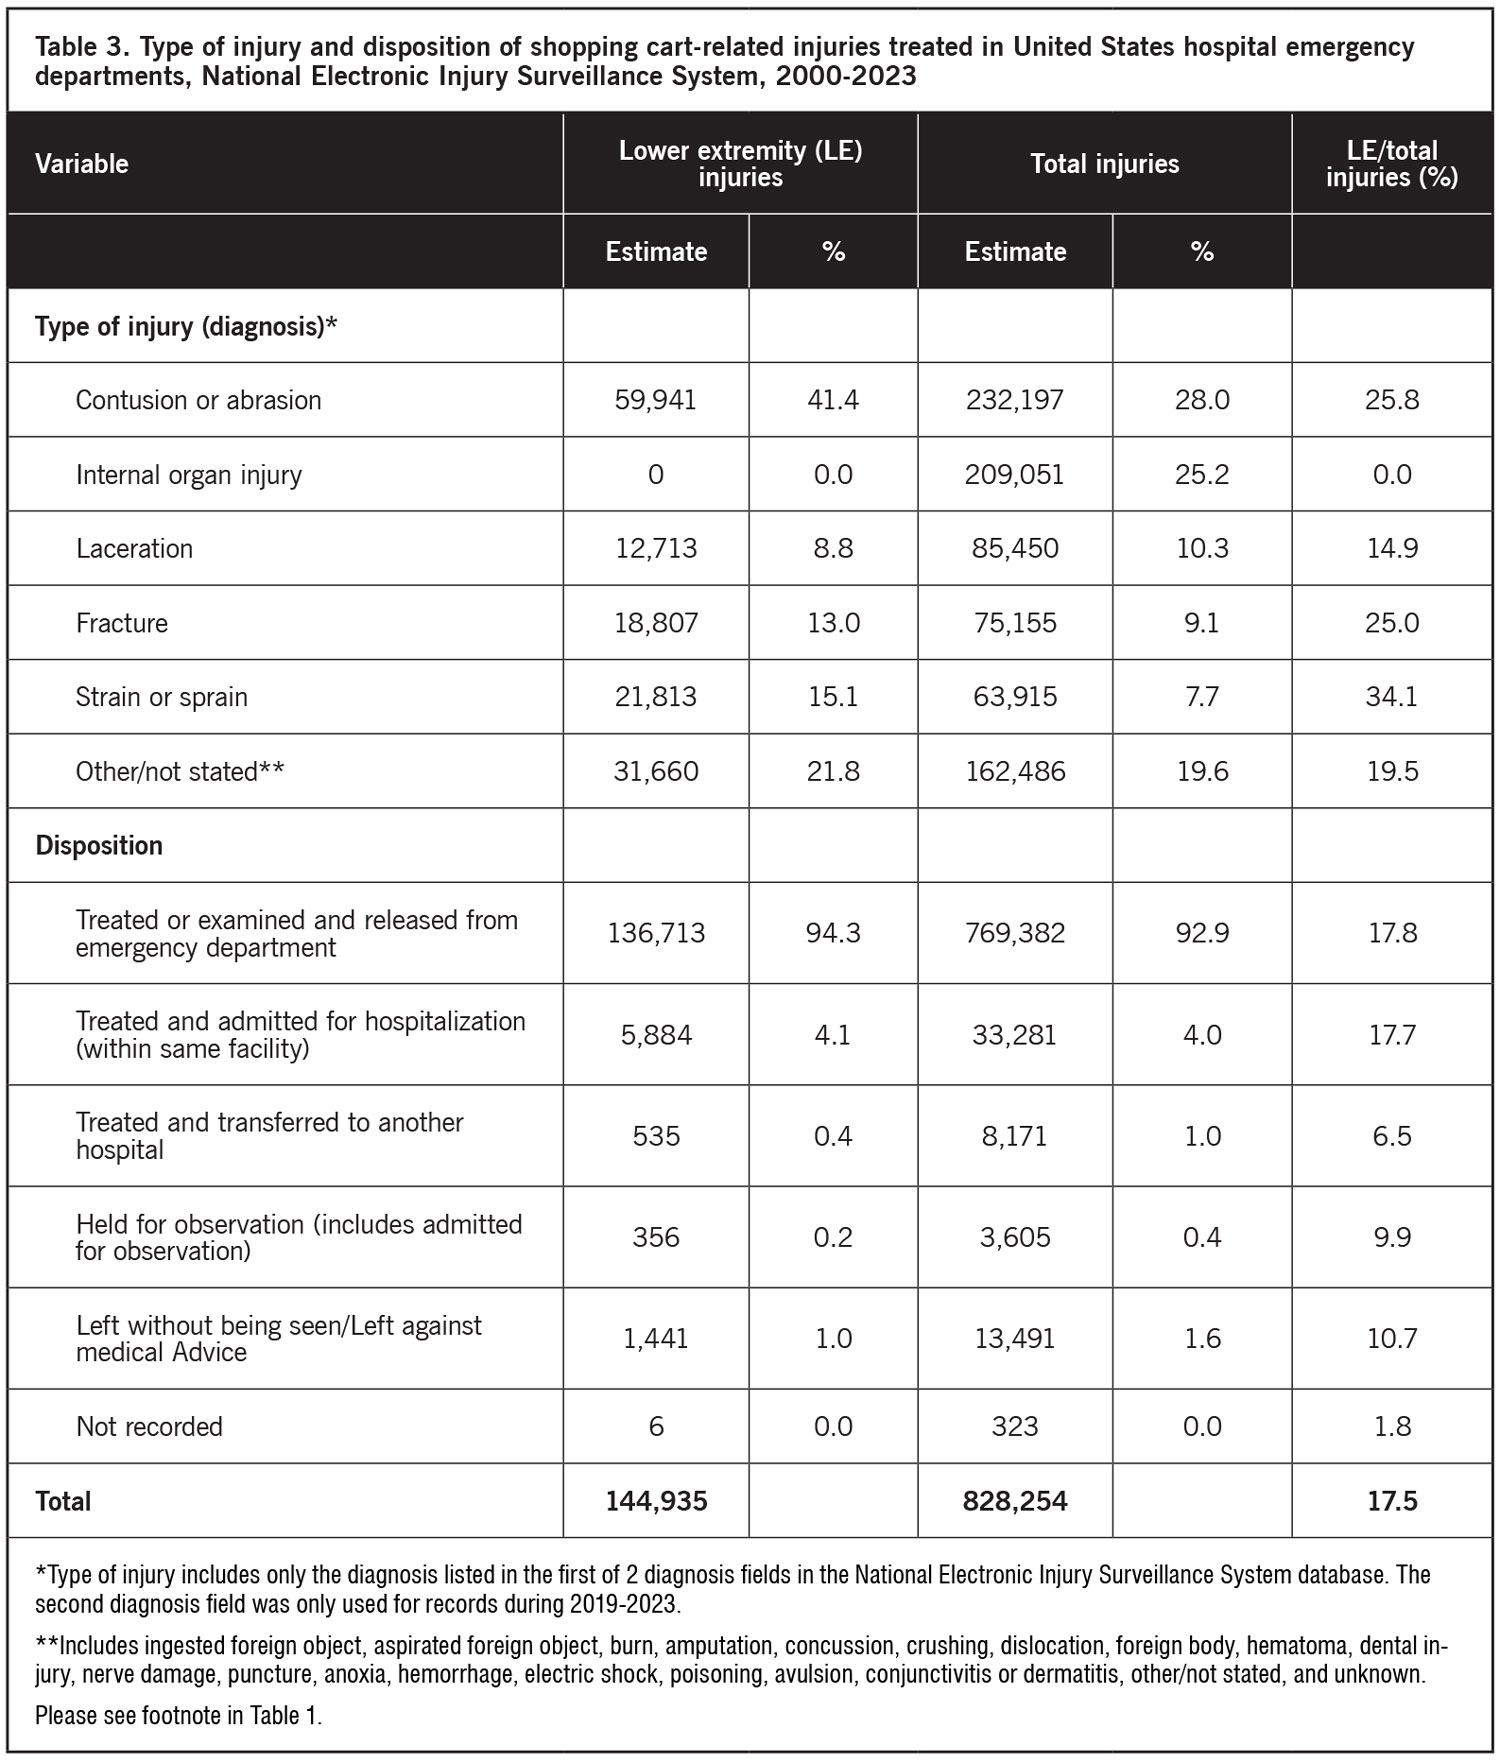
Table 3 shows the distribution of shopping cart-related injuries by type of injury (diagnosis) and disposition. The most common diagnoses among total injuries were contusion or abrasion, internal organ injury, and laceration. The most common diagnoses among lower extremity injuries were contusion or abrasion, strain or sprain, and fracture. For both groups, most patients were treated or examined at the ED and released.
Discussion
This study examined shopping cart-related injuries, assessing total injuries affecting all body parts and injuries affecting the lower extremity in particular. Tens of thousands of people are treated at US hospital EDs for shopping cart-related injuries each year (thousands of which involve lower extremity injuries). Examination of lower extremities is important because this study found that 17.5% of total shopping cart -related injuries affected the lower extremity. Furthermore, while previous studies used NEISS data to examine shopping cart-related injuries,3,4,9 these studies included only pediatric patients. This study found that 38.0% of total injuries and 77.5% of lower extremity injuries involved patients age 20 years and older.
Shopping cart-related lower extremity injuries increased during 2000-2014 and then decreased during 2015-2023. The decline in injuries during the last 9 years may be due to improvements in shopping cart safety and prevention efforts. Although total shopping cart-related injuries demonstrated a similar trend, they peaked a few years earlier, in 2010. Furthermore, the proportion of total injuries involving the lower extremity increased during the study period, from 14.2% during 2000-2003 to 20.3% during 2020-2023. These observations suggest that the factors related to the decline in shopping cart-related injuries did not affect lower extremity injuries to the same degree as it affected injuries of other body parts.
 Shopping cart-related lower extremity injuries differed from total injuries in several respects. In most total injuries, a fall, trip, or slip was mentioned; however, in most lower extremity injuries a fall, trip, or slip was not mentioned. For total injuries, the most common injury mechanisms were fell from or in shopping cart (no mention shopping cart tipped or fell over); fall, trip, or slip and shopping cart involved (patient not in or on shopping cart); and hit or hit by shopping cart. For lower extremity injuries, the most common mechanisms were hit or hit by shopping cart; fall, trip, or slip and shopping cart involved (patient not in or on shopping cart); and run over by shopping cart. These differences are likely related to the body parts most likely to be injured by a specific mechanism. When a person hits or is hit by a shopping cart, the lower extremity might be expected to be the body part most often involved in the hit. When a person is run over by a shopping cart, the lower extremity might be expected to be the body part most often run over. However, when a person falls from or in a shopping cart, depending on how they fall, any body part might be injured.
Although the majority of total injuries involved patients age 0-5 years, most lower extremity injuries involved patients age 20 years and older. While most patients in both injury groups were female, this proportion was higher for lower extremity injuries (72.0%) than for total injuries (56.7%). People of a certain age or sex may differ in their likelihood of experiencing a certain injury mechanism. For instance, children age 0-5 years might be more likely to ride in a shopping cart, and thus more likely to fall from or in a shopping cart (94.6% of total injuries in this study) or be in or on a shopping cart that tipped or fell over (82.6% of total injuries in this study). In contrast, 72.4% of the patients in this study who hit or were hit by a shopping cart were age 20 years or older, and 47.8% of the patients who were run over by a shopping cart were age 20 years or older.
The most common diagnoses among lower extremity injuries were contusion or abrasion, strain or sprain, and fracture. Most such injuries might not be expected to require treatment beyond the ED; in this study, 94.3% of the patients with lower extremity injuries were treated or examined in the ED and released.
Although the estimated number of shopping cart-related injuries treated at US hospital EDs has declined over the last decade, in 2023 there still were an estimated 27,532 total injuries and an estimated 4,844 lower extremity injuries. Thus, prevention of these injuries is still important. Previous publications have extensively discussed ways to prevent shopping cart-related injuries, particularly among children.3,4,14,15 These articles discuss public education, encouraging safe use of carts and adult supervision, provision of alternatives to placing children in carts while their caregivers shop, design changes to carts to prevent tip-overs and falls, and legislation.
There are limitations to this study. First, potential cases were initially identified by searching the 3 product code fields for product code 1679 (Grocery or shopping carts, unpowered). If this code was not used for a shopping cart-related injury, then the injury would not have been included in the study. Second, identification of the injury mechanism was performed by review of the Narrative field by a single person (the author). The injury circumstances in the Narrative field are not standardized. If the summary was incomplete or unclear, then the proper mechanism might not have been coded. Third, this study only included shopping cart-related injuries treated at hospital EDs. Examination of injuries not treated at hospital EDs would provide a more complete view of shopping cart-related injuries.
In conclusion, shopping cart-related lower extremity injuries treated at US hospital EDs occurred via a variety of mechanisms, the most common being hit or hit by shopping cart; fall, trip, or slip and shopping cart involved (patient not in or on shopping cart); and run over by shopping cart. The highest proportion of patients were age 20 years or older, and most patients were female. The most common type of injury was contusion or abrasion, followed by strain or sprain and fracture. Most patients were treated or examined in the ED and released. Considering that the pattern of shopping cart-related lower extremity injuries differed from total injuries in several respects, prevention activities may need to be modified to target those injury mechanisms and demographic groups most associated with lower extremity injuries.
Mathias B. Forrester, BS, is an independent researcher in Austin, Texas. Now retired, he previously performed public health research for various university and government programs for 38 years.
- Carriage Trade Service Company. What are the different types of shopping carts? August 5, 2022. Available at https://shopcarriage-trade.com/blog/what-are-the-different-types-of-shopping-carts/. Accessed Aug. 28, 2024.
- Wuhan Suyuan Commercial Equipment Co., Ltd. What are the different types of shopping carts? March 7, 2024. Available at https://www.suvametal.com/info/what-are-the-different-types-of-shopping-carts-93189209.html. Accessed Aug. 28, 2024.
- Martin KJ, Chounthirath T, Xiang H, Smith GA. Pediatric shopping-cart-related injuries treated in US emergency departments, 1990-2011. Clin Pediatr (Phila). 2014;53(3):277-285.
- Smith GA, Dietrich AM, Garcia CT, Shields BJ. Epidemiology of shopping cart-related injuries to children. An analysis of national data for 1990 to 1992. Arch Pediatr Adolesc Med. 1995;149(11):1207-1210.
- Vilke GM, Stepanski BM, Ray LU, Lutz MW, Murrin PA, Chan TC. 9-1-1 Responses for Shopping Cart and Stroller Injuries. Pediatr Emerg Care. 2004;20(10):660-663.
- Parry ML, Morrison LG, Chalmers DJ, Wright CS. Shopping trolley-related injuries to children in New Zealand, 1988-97. J Paediatr Child Health. 2002;38(1):51-54.
- Smith GA, Dietrich AM, Garcia CT, Shields BJ. Injuries to children related to shopping carts. Pediatrics. 1996;97(2):161-165.
- Jensen L, Charlwood C, Byard RW. Shopping cart injuries, entrapment, and childhood fatality. J Forensic Sci. 2008;53(5):1178-1180.
- Wright JW, Griffin R, MacLennan PA, Rue LW 3rd, McGwin G. The incidence of shopping cart-related injuries in the United States, 2002–2006. Accid Anal Prev. 2008;40(3):1253-1256.
- Woo EK. Shopping trolley-related accidents in the UK: a preventable cause of morbidity. J Paediatr Child Health. 2003;39(2):157-158.
- Forrester MB. Pickleball-related injuries involving the lower extremity treated in emergency departments. Lower Extremity Review. 2021;13(5):24-30.
- United States Consumer Product Safety Commission. National Electronic Injury Surveillance System (NEISS). Available at https://www.cpsc.gov/Research–Statistics/NEISS-Injury-Data/Explanation-Of-NEISS-Estimates-Obtained-Through-The-CPSC-Website. Accessed Aug. 29, 2024.
- United States Consumer Product Safety Commission. NEISS Coding Manual. January 2021. Available at https://www.cpsc.gov/s3fs-public/January-2021-NT-CPSC-only-NEISS-Coding-Manual.pdf?xa_nMM1kB4SGpuSMOwf0NHkkkIqNcn8F. Accessed Aug. 29, 2024.
- Smith GA; Committee on Injury, Violence, and Poison Prevention, American Academy of Pediatrics. Shopping-cart-related injuries to children. Pediatrics. 2006;118(2):e540-e544.
- Committee on Injury, Violence, and Poison Prevention, American Academy of Pediatrics. Shopping-cart-related injuries to children. Pediatrics. 2006;118(2):825-827.