Figure 1. Star Excursion Balance Test setup, with the anterior reach demonstrated.
Anterior-direction Star Excursion Balance Test performance may most appropriately discriminate between collegiate athletes who are and are not at risk for lower extremity injury, though additional research is needed to determine specific injury cutoff scores for other athletic populations.
By Mikel R. Stiffler-Joachim, MS; David R. Bell, ATC, PhD; and Bryan C. Heiderscheit, PT, PhD
Prevention of sports-related injuries is an area of interest for sports medicine researchers, clinicians, and coaches. Consequently, development of screening tests that can identify athletes who are at risk for a lower extremity injury has become the subject of many research investigations.1-6
In particular, the Star Excursion Balance Test (SEBT) was developed as an efficient and inexpensive test of dynamic balance to screen for injury risk. Initially designed with eight reach directions,7 the test has since been simplified to three directions: anterior (ANT), posterolateral (PL), and posteromedial (PM).8 To perform the SEBT, the participant stands on one leg with hands on hips and reaches as far as possible with the free lower limb in each of the directions (Figure 1). The reach is deemed invalid if the individual loses balance completely or moves the stance foot, removes the hands from the hips, or transfers weight to the reach foot. The reach distance is recorded as the maximal distance reached by the great toe.
Although SEBT performance has been repeatedly associated with both injury risk and injury recovery,6,9-11 the specific measurement (eg, reach distance, side-to-side asymmetry) most associated with injury risk remains inconsistent across studies. Therefore, our research group aimed to summarize the literature involving SEBT performance and injury, determine expected SEBT performance within our population of interest (National Collegiate Athletic Association Division I collegiate athletes), and assess SEBT performance and injury risk while controlling for secondary variables known to influence injury risk.
Normative data
SEBT scores can be compared to population-specific reference values, such as expected reach distances or typical side-to-side asymmetries. Although numerous investigations have aimed to develop injury cutoff scores, few studies have reported normative values, and differences in SEBT performance between sexes are varied.12-14 As a result, our research group characterized SEBT performance for healthy Division I collegiate athletes to evaluate the effect of sex and sport.
Our records review involved SEBT data for 393 Division I collegiate athletes from a single university who were healthy at the time of testing. Reach distances in the ANT, PL, and PM directions were normalized to leg length, and the composite (COMP) score was subsequently calculated. Side-to-side asymmetry in reach distance was also calculated for each direction and COMP score. Across all sports, average normalized reach distances ranged from 62% to 69%, 84% to 97%, and 99% to 113% of leg length in the ANT, PL, and PM directions, respectively (Table 1).11 Reach distance asymmetry ranged from 2 to 4 cm, 3 to 7 cm, and 3 to 6 cm in the ANT, PL, and PM directions, respectively (Table 2).11
Our primary finding was that SEBT performance is sport-specific in all directions and in COMP score. Among women’s teams, there were significant team differences in the PL and PM directions and COMP score, with women’s ice hockey athletes reaching farther than athletes on all other teams in the PL and PM directions.11 Women’s soccer athletes also reached farther than softball athletes in the PM direction and COMP score. Among men’s teams, significant team differences were observed in all directions.11 Men’s ice hockey athletes reached farther distances than athletes on all other teams in the PL direction and all other teams except wrestling in the ANT and PM directions and COMP score. These findings suggest an individual’s performance should be compared to normative values derived specific to his or her sport.11
Performance in the ANT direction alone demonstrated a significant interaction between sport and sex. Women achieved similar normalized reach distances to men participating in the same sport, except for those participating in soccer. Among soccer athletes, women were able to reach significantly farther than men. Interestingly, neither absolute nor normalized asymmetry in each of the SEBT directions was sport-specific and demonstrated no interaction effects.
In addition to reporting side-to-side asymmetry in reach distance in absolute terms, our study was also one of the first investigations to report normalized asymmetry (% leg length). Normalized reach distance asymmetry ranged from 3% to 4%, 5% to 8%, and 5% to 6% in the ANT, PL, and PM directions, respectively.11
Because limb lengths in our population of collegiate athletes averaged approximately 100 cm, our absolute asymmetry was very similar to our normalized asymmetry (eg, 4 cm of asymmetry = 4% asymmetry). However, among populations with shorter limb lengths, a 4-cm asymmetry may represent a much greater side-to-side difference when normalized to limb length, and therefore may be indicative of more asymmetrical performance between limbs. If providing normalized asymmetry data becomes standard for research in this area, that may enable comparisons to be more easily drawn across studies with regard to expected asymmetry within a given population and may also allow for more robust injury cutoffs to be developed.
Injury cutoff measures
Utilization of the SEBT as an injury screening tool has led to a variety of injury cutoff scores being proposed. For example, previous research determined that among recreationally active college students, PL direction reach distances less than 80% of limb length were associated with a 48% increase in ankle sprain injury risk.15 Alternatively, a cutoff of 4 cm of asymmetry in the ANT direction identified both high school basketball players6 and Division I collegiate football players16 who were and were not at risk for a lower extremity injury.
In a sample of Division III collegiate football players, Y-balance test (YBT; an instrumented version of the SEBT) COMP score symmetry below 89.6% identified athletes who were at risk for a noncontact lower extremity injury.17 However, among a sample of both high school and collegiate football players, reduced ANT direction reach distances on the SEBT, not asymmetry, were associated with injury risk.18
Additional considerations for injury risk
Several factors known to influence both SEBT performance and injury risk may help explain the inconsistencies between previous studies. For example, sport, sex, and athletic exposure (eg, level of competition, starting status) have all been shown to influence SEBT performance.19,20 These same factors also affect injury rates.
For example, noncontact knee and ankle injury rates are typically highest among football and basketball players.21,22 Additionally, women frequently demonstrate higher knee injury rates than men,22,23 and starters in college football are at greater risk for noncontact injuries than nonstarters.24 Consideration of these additional variables is needed to advance the SEBT as a robust screening test and ensure it is valid across a variety of populations.
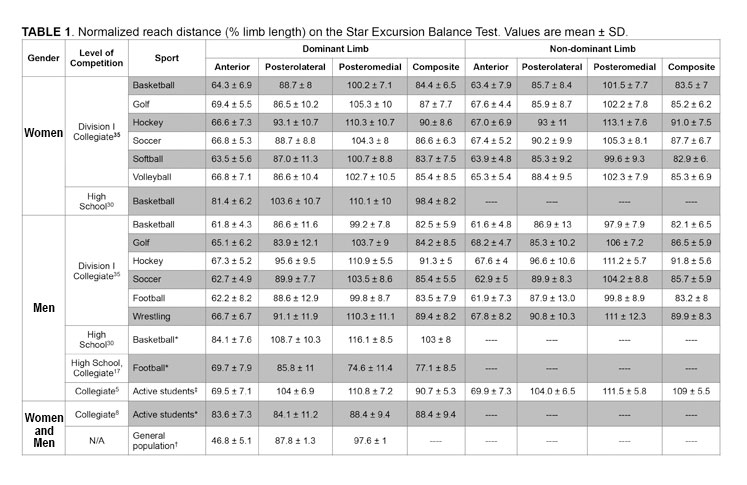
*Values represent the left and right limbs averaged together as no significant differences were observed between limbs.
†Values represent the right limb only as no significant differences were observed between limbs.
‡Right limb values are reported in the dominant limb columns, left limb values are reported in the nondominant limb columns.
To this end, we aimed to assess the relationship between SEBT performance and injury status while controlling for sport, sex, and athletic exposure, measured via starting status.11 We first identified a cohort of healthy athletes from a single academic year who had no history of lower extremity surgery and were cleared for full participation at their preseason testing time point. Based on medical records, we then identified individuals who either remained healthy over the course of their competitive season (n = 118) or went on to sustain a noncontact knee or ankle injury (n = 29).
For each athlete, SEBT reach distances in the ANT, PL, and PM directions were compiled for both limbs and normalized to limb length. We calculated a normalized COMP score, as well as absolute (cm) and normalized (% limb length) side-to-side asymmetries. Reach distances and COMP score were compared between the healthy and injured groups for the dominant limb (limb used to kick a ball for maximal distance) and nondominant limb, as well as for side-to-side asymmetry. Dominant-limb normalized ANT reach distance and COMP score; nondominant-limb normalized ANT, PL, and PM reach distance and COMP score; and both absolute and normalized ANT asymmetry were significantly different between those who did and did not sustain a noncontact knee or ankle injury. These eight variables were then entered into separate multivariable regression models to predict injury status while controlling for sport, sex, and starting status.
Our multivariable regression models indicated both absolute and normalized ANT side-to-side asymmetries best identified athletes who did and did not sustain a noncontact knee or ankle injury. Athletes who sustained an injury demonstrated approximately 1.8 cm (1.9% limb length) greater ANT side-to-side asymmetry than those who did not.11 However, given that the smallest detectable difference for the ANT direction of the SEBT has been reported as 6.9% to 9%,25,26 this difference may not be clinically meaningful. Therefore, we also calculated receiver operating characteristic curves to assess the efficacy of our multivariable models. Both models (absolute and normalized asymmetry) demonstrated area-under-the-curve values greater than .82, with approximately 88% optimal sensitivity and 67% optimal specificity.11

Although our study was the first to assess the relationship between SEBT performance and injury while controlling for variables influencing injury risk, our results are similar to previous investigations that have found ANT direction asymmetry to be most strongly related to injury risk. However, the degree of ANT asymmetry that indicates an athlete has an elevated risk of injury remains varied. Our investigation was unable to calculate a threshold or cutoff score as a result of our multivariable analyses, but application of the previously proposed 4-cm cutoff to our study sample would only correctly categorize 48% of the injured athletes and 73% of healthy athletes in our study.

As injury risk differs by sport and level of competition, so too may the SEBT thresholds that help identify if an athlete is at risk for injury. Consequently, we recommend that injury cutoffs be utilized only in the population for which they were developed, until cross-validation of the cutoff score has occurred in other populations.
Inconsistencies in methodology
Though the SEBT has been extensively studied, inconsistencies in methodology remain prevalent, such as stance foot alignment, hand placement, and direction identification.
Previously employed foot alignments have included: centering the foot at the intersection of the reach directions (origin),27,28 aligning the most distal portion of the great toe with the origin for all directions,3,11,20 and aligning the great toe with the origin for anterior directions and the heel to the origin for posterior directions (Figure 2).26,29,30
In our studies, athletes aligned their great toe with the origin for all directions. When comparing our normative values to studies that aligned the heel with the origin,26 our values were approximately 10% and 17% greater in the PL and PM directions, respectively.20 A recent study comparing foot position during the SEBT reported similar reductions of 17% and 6% in the PL and PM directions, respectively.31 Standardization of stance-foot placement during the SEBT would greatly improve the ability to compare results across studies and determine if true performance differences exist across populations.
Another area of inconsistency among SEBT research is hand placement. Athletes at our institution are required to maintain hands on hips for the duration of the reach to standardize trunk movement, as recommended by previous investigations.3 Other studies have allowed hands to be free from the hips and used for balance,26,32 which may facilitate better balance maintenance during the test33 and also be more reflective of an individual’s actual balance capabilities during sport (eg, hands are rarely restrained when an athlete needs to maintain balance in a sporting event). When comparing hand position (free vs fixed) with the great toe aligned with the origin, significantly greater reach distances were observed in all directions in the hands-free condition compared with the hands-fixed condition.31 Differences in hand position between studies will clearly influence the findings and make it difficult to summarize cumulative SEBT results and injury cutoffs across populations when methodologies between the studies differ.
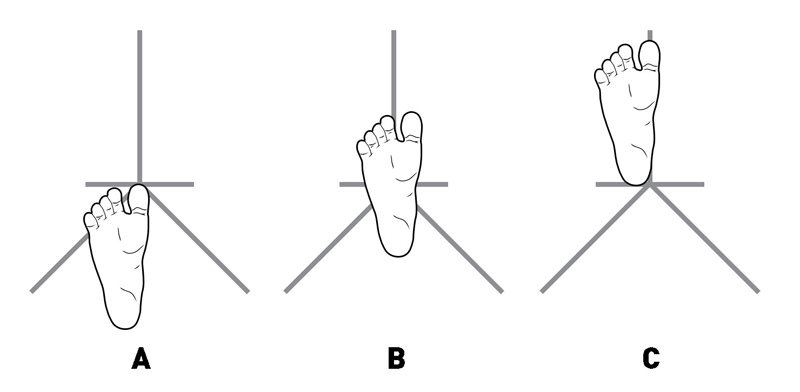
Figure 2. Star Excursion Balance Test foot position variations, with A) toes aligned to the origin, B) foot centered on the origin, and C) heel aligned to the origin.
Lastly, studies often identify the PL and PM directions differently. In early SEBT research, the PL direction was identified as reaching to the lateral side of the stance limb, such that the reach limb crossed behind the stance limb, and the PM direction was identified as reaching away from the medial side of the stance limb. However, a few recent investigations have defined the PL and PM directions in the opposite manner of the initial description of the SEBT.15,18,25,34 In instances in which the directions are explicitly described or a figure with directions labeled is available, comparisons may still be made across studies. However, the directions are often not explicitly described in the methods and a figure of the reach directions is provided infrequently as familiarity with the SEBT has increased, which can make it difficult to summarize collective findings from multiple SEBT investigations.
A final consideration when comparing normative and injury cutoffs values for the SEBT is the specific testing setup used. The YBT is an instrumented device used by many to perform the SEBT,35 which has led to the two tests often being viewed as interchangeable. Previous research comparing the two setups has shown YBT performance in the ANT direction is 3% less than SEBT performance in the ANT direction, with no significant differences observed between testing methods for the other directions.36
Given that the ANT direction has been the parameter most frequently associated with injury risk in previous SEBT investigations, it is possible the ANT direction on the YBT may also be the most informative regarding injury risk. However, due to the difference in ANT direction performance, the specific cutoff scores developed using the SEBT are likely not applicable to testing with the YBT apparatus. As a result, normative values and injury cutoff scores should continue to be developed separately for the SEBT and YBT.
Conclusion
The overall body of research on the SEBT to this point suggests ANT-direction SEBT performance may most appropriately discriminate between those who are and are not at risk for injury, though additional research is needed to determine population-specific injury cutoff scores.
To further the development of the SEBT as a screening test, both clinicians and researchers should aim to be more consistent in their methodologies with regard to the aforementioned areas of concern: foot alignment, hand placement, and directional labelling. Although the SEBT can be a useful screening tool, previously published injury cutoff scores have not been cross-validated, and care should be taken to apply injury cutoff scores only to the population for which the scores were developed.
Future investigations should continue to develop normative data for noncollegiate athletes and non-Division I collegiate athletes, determine injury cutoff scores for sports not currently represented in the literature, and cross-validate injury cutoff scores to ensure they are robust and valid.
Mikel R. Stiffler-Joachim, MS, is a research specialist in the Department of Orthopedics and Rehabilitation at the University of Wisconsin-Madison (UWM). David R. Bell, ATC, PhD, is an assistant professor in the Department of Kinesiology at UWM. Bryan C. Heiderscheit, PT, PhD, is professor in the Doctor of Physical Therapy program at UWM.
- Asadi A, Saez de Villarreal E,Arazi H. The effects of plyometric type neuromuscular training on postural control performance of male team basketball players. J Strength Cond Res 2015;29(7):1870-1875.
- Dallinga JM, Benjaminse A, Lemmink KA. Which screening tools can predict injury to the lower extremities in team sports? A systematic review. Sports Med 2012;42(9):791-815.
- Gribble PA, Hertel J, Plisky P. Using the Star Excursion Balance Test to assess dynamic postural-control deficits and outcomes in lower extremity injury: a literature and systematic review. J Athl Train 2012;47(3):339-357.
- Khayambashi K, Ghoddosi N, Straub RK, Powers CM. Hip muscle strength predicts noncontact anterior cruciate ligament injury in male and female athletes: a prospective study. Am J Sports Med 2015;44(2):355-361.
- Lehr ME, Plisky PJ, Butler RJ, et al. Field-expedient screening and injury risk algorithm categories as predictors of noncontact lower extremity injury. Scand J Med Sci Sports 2013;23(4):e225-e232.
- Plisky PJ, Rauh MJ, Kaminski TW, Underwood FB. Star Excursion Balance Test as a predictor of lower extremity injury in high school basketball players. J Orthop Sports Phys Ther 2006;36(12):911-919.
- Hertel J, Miller SJ, Denegar CR. Intratester and intertester reliability during the Star Excursion Balance Test. J Sport Rehabil 2000;9(2):104-116.
- Hertel J, Braham RA, Hale SA, Olmsted-Kramer LC. Simplifying the Star Excursion Balance Test: analyses of subjects with and without chronic ankle instability. J Orthop Sports Phys Ther 2006;36(3):131-137.
- Herrington L, Hatcher J, Hatcher A, McNicholas M. A comparison of Star Excursion Balance Test reach distances between ACL deficient patients and asymptomatic controls. Knee 2009;16(2):149-152.
- Olmsted LC, Carcia CR, Hertel J, et al. Efficacy of the Star Excursion Balance Tests in detecting reach deficits in subjects with chronic ankle instability. J Athl Train 2002;37(4):501-506.
- Stiffler MR, Bell DR, Sanfilippo JL, et al. Star Excursion Balance Test anterior asymmetry is associated with injury status in division I collegiate athletes. J Orthop Sports Phys Ther 2017;47(5):339-346.
- Gribble PA, Hertel J. Considerations for normalizing measures of the Star Excursion Balance Test. Meas Phys Educ Exerc Sci 2003;7(2):80-100.
- Gribble PA, Robinson RH, Hertel J, Denegar CR. The effects of gender and fatigue on dynamic postural control. J Sport Rehabil 2009;18(2):240-257.
- Sabin MJ, Ebersole KT, Martindale AR, et al. Balance performance in male and female collegiate basketball athletes: influence of testing surface. J Strength Cond Res 2010;24(8):2073-2078.
- de Noronha M, França LC, Haupenthal A, Nunes GS. Intrinsic predictive factors for ankle sprain in active university students: a prospective study. Scand J Med Sci Sports 2013;23(5):541-547.
- Smith CA, Chimera NJ, Warren M. Association of Y balance test reach asymmetry and injury in division I athletes. Med Sci Sports Exerc 2015;47(1):136-141.
- Butler RJ, Lehr ME, Fink ML, et al. Dynamic balance performance and noncontact lower extremity injury in college football players: an initial study. Sports Health 2013;5(5):417-422.
- Gribble PA, Terada M, Beard MQ, et al. Prediction of lateral ankle sprains in football players based on clinical tests and body mass index. Am J Sports Med 2016;44(2):460-467.
- McCann RS, Kosik KB, Beard MQ, et al. Variations in Star Excursion Balance Test performance between high school and collegiate football players. J Strength Cond Res 2015;29(10):2765-2770.
- Stiffler MR, Sanfilippo JS, Brooks MA, Heiderscheit BC. Star Excursion Balance Test Performance varies by sport in healthy Division I collegiate athletes. J Orthop Sport Phys Ther 2015;45(10):772-780.
- Agel J, Klossner D. Epidemiologic review of collegiate ACL injury rates across 14 sports: national collegiate athletic association injury surveillance system data 2004-05 through 2011-12. Br J Sports Med 2014;48(7):560.
- Hootman JM, Dick R, Agel J. Epidemiology of collegiate injuries for 15 sports: summary and recommendations for injury prevention initiatives. J Athl Train 2007;42(2):311-319.
- DeHaven KE, Lintner DM. Athletic injuries: Comparison by age, sport, and gender. Am J Sports Med 1986;14(3):218-224.
- Wilkerson GB, Colston MA. A Refined prediction model for core and lower extremity sprains and strains among collegiate football players. J Athl Train 2015;50(6):643-650.
- Hyong IH, Kim JH. Test of intrarater and interrater reliability for the Star Excursion Balance Test. J Phys Ther Sci 2014;26(8):1139-1141.
- Munro AG, Herrington LC. Between-session reliability of the Star Excursion Balance Test. Phys Ther Sport 2010;11(4):128-132.
- Gribble PA, Hertel J, Denegar CR, Buckley WE. The effects of fatigue and chronic ankle instability on dynamic postural control. J Athl Train 2004;39(4):321-329.
- Gribble PA, Kelly SE, Refshauge KM, Hiller CE. Interrater reliability of the Star Excursion Balance Test. J Athl Train 2013;48(5):621-626.
- Earl JE, Hertel J. Lower-extremity muscle activation during the star excursion balance tests. J Sport Rehabil 2001;10(2):93-104.
- Sawkins K, Refshauge K, Kilbreath S, Raymond J. The placebo effect of ankle taping in ankle instability. Med Sci Sports Exerc 2007;3(5):781-787.
- Cug M. Stance foot alignment and hand positioning alter star excursion balance test scores in those with chronic ankle instability: What are we really assessing? Physiother Theory Pract 2017;33(4):316-322.
- Gorman PP, Butler RJ, Rauh MJ, et al. Differences in dynamic balance scores in one sport versus multiple sport high school athletes. Int J Sports Phys Ther 2012;7(2):148-153.
- Marigold DS, Bethune AJ, Patla AE. Role of the unperturbed limb and arms in the reactive recovery response to an unexpected slip during locomotion. J Neurophysiol 2003;89(4):1727-1737.
- Ambegaonkar JP, Cortes N, Caswell SV, et al. Lower extremity hypermobility, but not core muscle endurance influences balance in female collegiate dancers. Int J Sports Phys Ther 2016;11(2):220-229.
- Plisky PJ, Gorman PP, Butler RJ, et al. The reliability of an instrumented device for measuring components of the Star Excursion Balance Test. N Am J Sports Phys Ther 2009;4(2):92-99.
- Coughlan GF, Fullam K, Delahunt E, et al. A comparison between performance on selected directions of the Star Excursion Balance Test and the Y balance test. J Athl Train 2012;47(4):366-371.