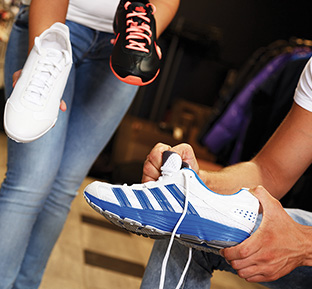
 Research suggests that when trying on athletic shoes in a retail store, an individual’s perceptions of shoe mass primarily come from handling the shoes and less (if at all) from test-wearing them. In addition, the foot’s perception of shoe mass does not appear to improve with practice.
By Joel G. Greenya, BS, Stephen J. Slade, BS, Christopher L. Kliethermes, PhD, and David S. Senchina, PhD
Lightweight shoes are popular across a variety of sports and especially in running. They are variously labeled “performance” shoes (for racing or competition), “minimalist” or “barefoot-inspired” shoes (to emulate barefoot running conditions), or simply “lightweight” shoes. Table 1 lists characteristics of lightweight running shoes compared with standard running shoes.
The obvious marketing angle of these shoes is their light weight, or more accurately, lesser mass compared with standard counterparts. Whether and how consumers can perceive mass differences between various shoe models is an important consideration from consumer, athletics, and retail industry perspectives.
A practical question is: Are the sensory capabilities of the foot fine enough to tell the difference between a lightweight running shoe and a standard training shoe? A few years ago our research team asked this question and was surprised to find nothing in the literature on this topic.
In this article, we will first review what is known about the sensory abilities of the lower extremity. Then we will describe a pair of experiments we devised to address the aforementioned question, as well as a third, previously unpublished experiment examining whether the mass-perception abilities of the foot might improve through repetition. Lastly, we will discuss take-home messages from the work.
Comfort perception: Human factors

Table 1. The mass and heel-to-toe drop of both lightweight trainers and standard trainers from seven popular brands were surveyed. Lightweight trainers have a much lower heel-to-toe drop than standard trainers and consistently weigh less. Masses were based on a men’s size 9 shoe.
Published research on the sensory abilities of the lower extremity has largely focused on comfort perception. This is not surprising given the importance of comfort to footwear design and marketing,1,2 and that most running shoes are bought for “everyday” use.3 Research has soundly established that both wearer and shoe characteristics influence comfort ratings.
Several wearer characteristics may influence subjective comfort ratings. Two studies from researchers at the University of Calgary in Canada demonstrated the importance of skeletal characteristics.
In one study, Miller and colleagues measured body characteristics of adult participants and then looked for associations between those characteristics and the participants’ comfort ratings of three different court shoes.4 One characteristic measured was β-angles (an angle between the calf midline and heel midline). Individuals with smaller β-angles tended to rate shoes as more comfortable overall than those with larger β-angles. In another study, Mündermann and colleagues measured body characteristics of military personnel and then had them evaluate the comfort of combat boot orthoses.5 Foot arch height, foot sensitivity, forefoot flexion angle, and Q-angle (a measure of alignment between the upper and lower leg) all influenced comfort scores.
Soft tissue characteristics may also be important. In a study of both younger and older adults, Menant and colleagues reported that older adults (but not younger adults) rated soft-soled Oxford-style shoes as less comfortable and less stable than similar models, which the researchers attributed to the older adults’ decreased foot sensitivity relative to their younger counterparts.6
Comfort perception: Footwear factors
Several footwear characteristics may also influence comfort ratings. These features may be categorized as “unalterable” (inherent in the shoe’s design) or “alterable” (adjustable by the wearer).

Figure 1. Influence of footwear on comfort perception in the context of American football shoes (cleats). Values are averages ± standard deviation. (a) Data from Faganel et al8 showing athletes perceived low-top cleats as more comfortable than mid-top cleats. Athletes’ ankles were spatted during the experiment. (b) Data from Reuter et al12 showing athletes perceived bracing as more comfortable than either taping alone or taping combined with spatting.
There are many documented unalterable footwear conditions that influence comfort ratings. Two examples are sole characteristics and shoe height.
In the aforementioned study by Menant et al,6 sole hardness and heel elevation were important determinants of comfort. Other research teams, like Dinato and colleagues at the University of São Paulo in Brazil, have shown that midsole composition may influence comfort.7
Shoe height may also be important. Research from our laboratory at Drake University in Des Moines, IA, has shown that young adult athletes rated mid-top football shoes as less comfortable than low-top football shoes (Figure 1a).8
Likewise, there are many documented alterable footwear conditions that influence comfort ratings. Shoelace patterns, inserts or foot orthoses, and bracing and taping regimens are all examples.

Figure 2. Design of the Slade et al17 shoe-mass perception experiment.
Hagen and Hennig of the University of Duisberg-Essen in Germany fitted 20 runners with the same shoe in six different lacing conditions and asked their perceptions of comfort and stability.9 Moderate tightness and full lacing were associated with the highest comfort and stability scores, respectively.
In addition to the previously mentioned work by Mündermann et al,5 in which it was shown that body characteristics influence perception of orthotics comfort, Mills and colleagues in Australia asked volunteers to judge the comfort of four orthotic devices and reported that individuals prioritized contouring over stiffness when they assessed comfort.10
Udermann and colleagues showed that young adult athletes found taping more comfortable than spatting after playing one hour of American-style touch football in football cleats.11 Research from our laboratory at Drake University has shown that after completing sprint-type field drills in football cleats, young adult athletes perceived traditional lace-up ankle braces as more comfortable than either standard ankle taping regimens or ankle taping plus spatting (Figure 1b).12 This work suggests increasing layers on the ankle may decrease comfort.

Mass perception
It seems logical to assume that many of the wearer and shoe factors that affect comfort perception might also affect perception of other variables, such as mass, but that assumption remains untested. Far fewer studies of mass perception exist than studies of comfort perception.
The lower extremity perceives mass through mechanoreceptors in its tissues. Kennedy and Inglis of the University of British Columbia in Vancouver, Canada, have shown that these receptors require stronger stimuli to activate than do receptors in the hand because the skin covering receptors in the foot is thicker.13

Figure 3. Experimental procedures from the Slade et al17 shoe-mass perception experiment. (a-c) Foot test. (a)Subjects were fitted with taped goggles that kept them from viewing their feet or other shoes. The experimenter placed both shoes from a single pair on the subject’s feet. (b)The subject had 60 seconds to walk/jog/run, stand in place, or perform any other movements of their choice, aside from touching the shoes. Then the experimenter removed both shoes. (c)The subject was given two scales to record their first impressions of the shoe. Each scale was a 10-cm line anchored with opposing phrases on each side (not comfortable at all—most comfortable, not heavy at all—most heavy imaginable). Subjects marked the line as they felt. (d)Hand test A. One shoe from each pair was placed behind a sash and subjects blindly ordered them from lightest to heaviest. (e-f) Hand test B. (e)The experimenter placed one shoe into the subject’s hands. The subject had 60 seconds to hold/switch/toss or perform any other movements of their choice. (f)The subject marked their perception of shoe mass on the scale. Calvin W. Daack volunteered as the experimenter for these photos.
Three previous studies have investigated mass-perception abilities of the lower extremity. In a study of below-knee amputees, Donn et al attached shoes with different masses to the participants’ prostheses and gauged their preferences for the test shoes compared with their own shoes.14 Although accuracy was not a component of the study, the results suggested amputees could discern mass through their prostheses.
Hajnal and colleagues at the University of Connecticut in Storrs and the Federal University of Minas Gerais in Belo Horizonte, Brazil, communicated two studies of length perception that, by their design, were also studies of mass perception.15,16 In both experiments, participants wielded rods of varying length with both hands or both feet. The hand and foot were equally accurate in assessing length.
These studies may not relate directly to shoe-mass perception by the general population. All three experiments involved a lever that placed the mass external from the limb perceiving it. By contrast, a shoe wraps around the foot and likely involves different sensory pathways, so these studies cannot address the question posed earlier.
Experimental approach to the question
We devised an experiment17 to address the question of how accurately the foot could perceive the relative mass of running shoes. The five shoes tested were the same make and series, but different models that ranged in mass from 220 to 360 g (7.8-12.7 oz). We were also interested in how the relative accuracy of the foot compared with that of the hand, and how other variables (such as body characteristics, perceived comfort, or how wearers tested the shoes) influenced the results. In this article, “foot” will represent both the foot and lower extremity together, and “hand” will represent both the hand and upper extremity together.
Fifty young adult men capable of exercising in a size 12 men’s shoe participated (age, 21 ± 4 years; height, 71 ± 2 in; weight, 161 ± 22 lb). Each visited the lab once and completed both a foot test and a hand test (Figure 2). All participants interacted with the same five pairs of men’s size 12 running shoes, all from the same manufacturer and series. Each participant wore a pair of laboratory goggles taped along the bottom so they could not see their feet, and a new pair of identical ankle-cut socks to eliminate sock influences on perception. Researchers placed shoes on the participants’ feet.
The foot test was identical for all 50 participants (Figure 3a-c). Each individual had 60 seconds to try on each pair of shoes and walk, run, jump, stand, or take whatever actions they wished without looking at or touching the shoes. Then they rated their perceptions of comfort and shoe mass on a 10-cm visual analog scale.18 After trying on all five shoes, they verbally ranked the shoes from lightest to heaviest.
The hand test was conducted two different ways (hand test A and B), with half of the participants completing each test (Figure 3). In hand test A (Figure 3d), five different shoes were concealed behind a sash and participants arranged them from lightest to heaviest. In hand test B (Figure 3e-f), participants had 60 seconds to heft each shoe and then report perceived mass according to the visual analog scale, just as they had done during the foot portion. After hefting all five shoes, they verbally ranked the shoes from lightest to heaviest.
The foot test and hand test A were similar to what a consumer might do when testing shoes in a shoe store. However, because the two approaches were so different, we could not directly compare foot and hand sensory abilities. So we designed hand test B to be as similar as possible to the foot test to permit a more direct comparison between foot and hand perception.
How well does the foot perceive mass?
Based on verbal reporting (after participants experienced all five shoes), mass perception accuracy was 30% in the foot test, 92% in hand test A, and 63% in hand test B (Figure 4).17 Based on a comparison of scale ratings (after testing each shoe individually), mass perception accuracy was 30% in the foot test and 50% in hand test B.17

Figure 4. The hand perceives shoe mass much more accurately than the foot. Values areaverages ± standarddeviation .DatafromSladeetal.17
From this data, we concluded the foot did a poor job of discerning mass relative to the hand. One exception was that the foot was generally able to perceive differences between the heaviest shoe and the lightest shoe, a difference of approximately 140 g (4.9 oz).
We also explored whether other variables influenced the results. None of the body characteristics (height, weight, hip or waist circumference, leg length, Q-angle, pelvis width, foot length, or foot arch type) correlated with mass perception findings.17 There were no correlations between perceived comfort and actual mass or between perceived comfort and perceived mass, meaning that shoe mass and comfort appear to be unrelated.17 There were no correlations between mass perception accuracy and how individuals spent their time wearing or holding the shoes.17
Does repetition improve accuracy?
Seeing how poorly our study participants did in perceiving shoe mass with their feet, we wondered: If the subjects repeated the task a second time, would their accuracy improve? Fifteen of the 50 participants (all of whom performed the foot test and hand test A; age, 23 ± 6 years; height, 71 ± 2 in; weight 154 ± 12 lb) returned and repeated the experiment one week after the first visit.
Accuracy did not improve between trials (Figure 5). For the foot test, accuracy was 45% in the first trial compared with 51% in the second trial. This may appear to be an improvement, but the error ranges of the two trials overlapped enough that the difference was not statistically significant. For the hand test, accuracy was 93% in the first trial compared with 92% in the second trial. As with the previous study,17 there were no correlations between perceived comfort and actual shoe mass or between perceived comfort and perceived shoe mass.
It’s possible that a practice effect might be seen if more sessions were included, or if the sessions were spaced more closely together. It’s unknown why this subpopulation had higher foot accuracy than the larger population from the previous study (50% vs 30%), but the findings indicate person-to-person variation.
Take-home messages
Four big take-home messages come from these results.
First, if someone is trying on shoes at a retail store, then their perceptions of shoe mass probably come from their hands during handling and less (if at all) from the time spent test-wearing the shoes. If a person wants to gauge a shoe’s mass, they’re better off holding than wearing it.

Figure 5. Repeated exposure does not improve shoe-mass perception by the foot. Values are averages ± standard deviation. Significance was determined through t- tests, with values of < .05 being significant. There were no significant differences between first and second visits for either the foot test (p = .52) or hand test (p = .93). Previously unpublished data.
Second, lighter weight was not associated with greater comfort. If a person is purchasing shoes online instead of trying them out in a store, they shouldn’t assume that a shoe with less mass will be more comfortable.
Third, though the feet’s ability to perceive mass across the range of shoes was generally poor, participants were able to consistently differentiate the lightest shoe from the heaviest shoe. The lightest shoe was a racing flat, whereas the heaviest shoe was a traditional trainer. If a person is trying on shoe models that represent opposing ends of the shoe mass spectrum and not “in-between” models, they may be able to perceive mass differences through the feet. It is unclear how these findings might apply to shoes outside the range of masses used in this study. Our research team is performing additional work to better define the “just noticeable difference.”
Fourth, foot perception of shoe mass may not be improved with practice. Recall that foot mechanoreceptors need large stimuli to activate.13 Practice will not likely change foot skin thickness, so it could be that shoe-mass differences of less than 140 g simply cannot be perceived consistently by the foot regardless of practice. But perception of shoe mass is not limited to the foot—other components of the lower extremity also contribute.14-16 Person-to-person variation may also come into play. Our research team is also conducting more experiments to identify additional factors that may contribute to perception of shoe mass.
Joel G. Greenya, BS, currently a medical student at Midwestern University in Chicago, and Stephen J. Slade, BS, currently a currently a medical student at the University of Iowa in Iowa City, performed the research in partial fulfillment of biology degree thesis requirements at Drake University in Des Moines, IA. Christopher L. Kliethermes, PhD, is an assistant professor of psychology at Drake University. David S. Senchina,PhD, is an associate professor of biology at Drake University and was the thesis advisor. All four authors contributed to the writing of this piece.
- Clinghan R, Arnold GP, Drew TS, et al. Do you get value for money when you buy an expensive pair of running shoes? Br J Sports Med 2008;42(3):189-193.
- Robbins S, Waked E. Hazard of deceptive advertising of athletic footwear. Br J Sports Med 1997;31(4):299-303.
- Branthwaite H, Chockalingam N. What influences someone when purchase new trainers? Footwear Sci 2009;1(2):71-72.
- Miller JE, Nigg BM, Liu W, et al. Influence of foot, leg, and shoe characteristics on subjective comfort. Foot Ankle Int 2000;21(9):759-767.
- Mündermann A, Stefanshyn DJ, Nigg BM. Relationship between footwear comfort of shoe inserts and anthropometric and sensory factors. Med Sci Sports Exerc 2001;33(11):1939-1945.
- Menant JC, Perry SD, Steele JR, et al. Effects of shoe characteristics on dynamic stability when walking on even and uneven surfaces in young and older people. Arch Phys Med Rehabil 2008;89(10):1970-1976.
- Dinato RC, Ribeiro AP, Butugan MK, et al. Biomechanical variables and perception of comfort in running shoes with different cushioning technologies. J Sci Med Sport 2014 Jan 1. [Epub ahead of print]
- Faganel PP, Drake TC, Dahl-Miller AR, Senchina DS. Height variation in football shoes (cleats) for running backs and receivers may not alter ankle spatting effects in football field drills. J Undergrad Res 2013;4(1):6-10.
- Hagen M, Hömme AK, Umlauf T, Hennig EM. Effects of different shoe-lacing patterns on dorsal pressure distribution during running and perceived comfort. Res Sports Med 2010;18(3):176-187.
- Mills K, Blanch P, Vicenzino B. Influence of contouring and hardness of foot orthoses on ratings of perceived comfort. Med Sci Sports Exerc 2011;43(8):1507-1512.
- Udermann BE, Miller KC, Doberstein ST, et al. Spatting restricts ankle motion more effectively than taping during exercise. Int J Exerc Sci 2009;2(2):72-82.
- Reuter GD, Dahl AR, Senchina DS. Ankle spatting compared to bracing or taping during maximal-effort sprint drills. Int J Exerc Sci 2011;4(1):49-64.
- Kennedy PM, Inglis JT. Distribution and behavior of glabrous cutaneous receptors in the human foot sole. J Physiol 2002;538(Pt 3):995-1002.
- Donn JM, Porter D, Roberts VC. The effect of footwear mass on the gait patterns of unilateral below-knee amputees. Prosthet Orthot Int 1989;13(3):140-144.
- Hajnal A, Fonseca S, Harrison S, et al. Comparison of dynamic (effortful) touch by hand and foot. J Mot Behav 2007;39(2):82-88.
- Hajnal A, Fonseca S, Kinsella-Shaw JM, et al. Haptic selective attention by foot and hand. Neurosci Lett 2007;419(1):5-9.
- Slade SJ, Greenya JG, Kliethermes CL, Senchina DS. Somatosensory perception of running shoe mass. Ergonomics 2014;57(6):912-920.
- Mills K, Blanch P, Vicenzino B. Identifying clinically meaningful tools for measuring comfort perception of footwear. Med Sci Sports Exerc 2010;42(10):1966-1971.